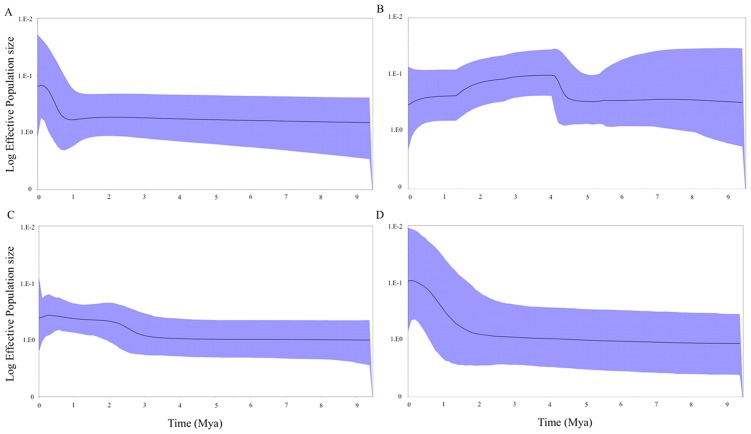
Figure 6. Bayesian skyline plots showing T. dimidiata population size changes over time.
The relative population size measured as a product-effective population size (y-axis) is shown over time in millions of years (x-axis) in simulated coalescent-based genealogies using A) ND4 Colombian haplotypes, B) combined ND4 and CO1 Colombian haplotypes, C) ND4, and D) partial ITS-2 haplotypes including Central American and Mexican conspecific sequences (Table S1). The thick black line is the median estimate and the solid (blue) interval shows the 95% highest posterior density limits.

