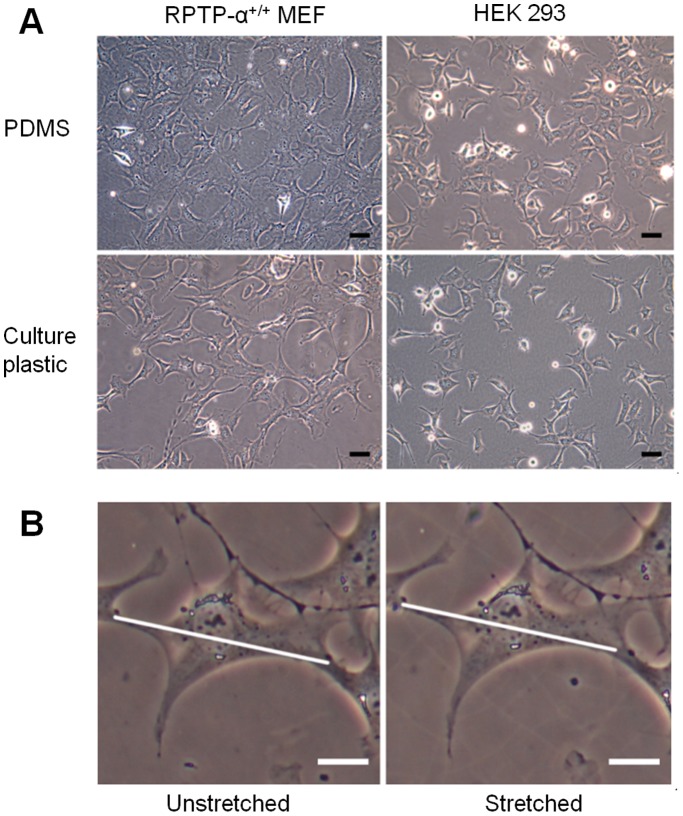
Figure 5. Cell culture on collagen-coated PDMS membranes.
(A) Phase-contrast images (20 X) of RPTP-α+/+ MEFs (left) and HEK 293A cells (right), respectively. The upper row shows images of cells cultured on the PDMS membrane, while the lower row depicts cells on standard tissue-culture plastics (polystyrene). Scale bars: 50 µm. (B) Images of an RPTP-α+/+ MEF cell before (left) and after (right) application of 10% equibiaxial strain. The diagonal lines indicate the cell length before stretching the membrane. Note the increase of the cell dimension upon membrane stretching. Scale bars: 20 µm. The images were acquired using a manually operated device (Figure S3).

