
Fig. 1.
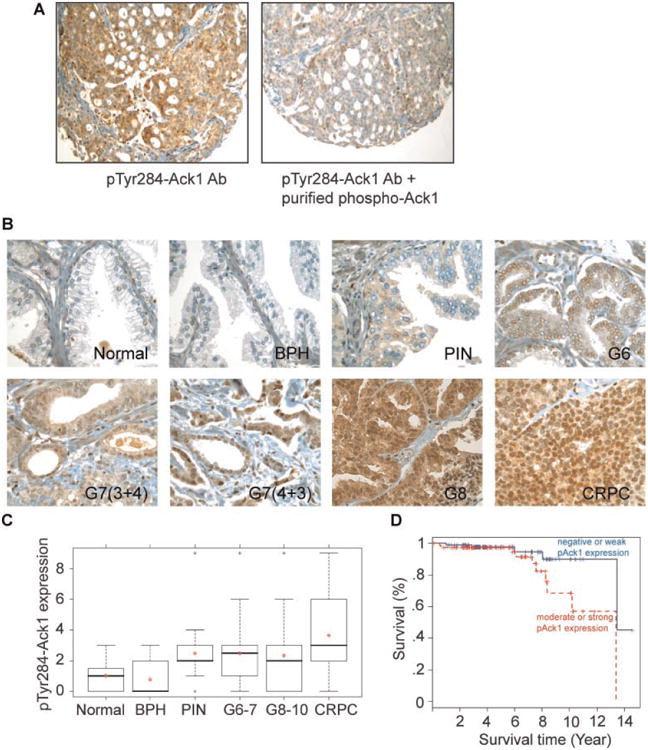
pTyr284-Ack1 expression correlates positively with disease progression and negatively with survival of prostate cancer patients. A: Validation of pTyr284-Ack1antibodies for immunohistochemistry studies. Prostate tumor samples were fixed and sectioned followed by immunohistochemical staining with pTyr284-Ack1 antibodies (left panel). Prostate tumor sample sections were stained with pTyr284 -Ack1 antibodies that were blocked by incubation with purified activated Ack1 protein (right panel). B: TMA sections representing different prostate cancer stages were stained with pTyr284 -Ack1 antibodies. C: Box plots to summarize distributions of staining intensities for pTyr284 -Ack1 in different stages of prostate cancer. The box has lines at the lower quartile (25%), median (50%), and upper quartile values (75%), while the red-cross within the circle marks the mean value. Whiskers extend from each end of the box to the most extreme values within 1.5 times the inter-quartile range from the ends of the box. The data with values beyond the ends of the whiskers, displayed with black circles, are potential outliers. A significant increase in expression of Tyr284-phosphorylated Ack1 (Spearman's rank correlation coefficient = 0.32, P<0.0001) was seen as prostate cancer progressed. D: Kaplan–Meier survival curves shows that individuals with prostate cancer that have moderate to strong staining of pTyr284-Ack1 (>2)have a significantly worse overall survival outcome than those with lower pTyr284-Ack1 levels(log-rank P=0.041).