
Fig. 3.
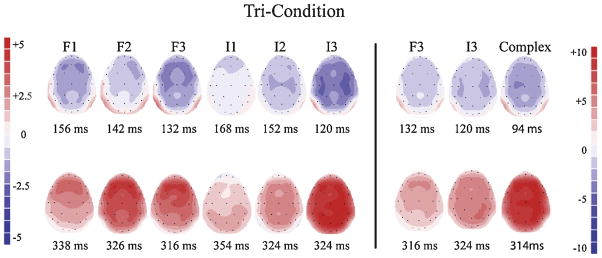
Experiment 1: Tri-Condition. Scalp voltage maps for each deviant displaying the peak latency of the difference waveforms used to measure the MMN (top) and P3a (bottom) components for the frequency deviants (F1/F2/F3), intensity (I1/I2/I3) deviants, and complex tone. The right panel provides a comparison of the complex tone with the largest frequency (F3) and intensity (I3) deviants. Note the difference in scale for the comparison with the complex tone (right panel) and the comparison among the frequency and intensity deviants (left panel). Red indicates positive polarity and blue indicates negative polarity. (For interpretation of the references to color in this figure legend, the reader is referred to the web version of this article.)