
Fig. 6.
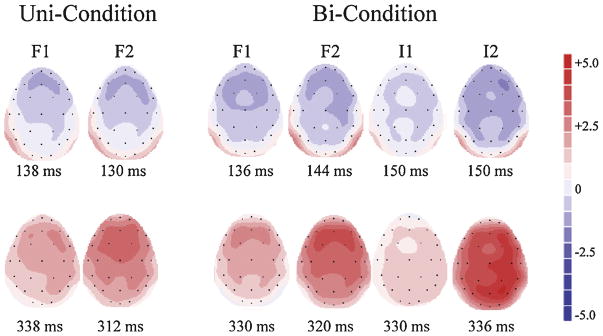
Experiment 2: Scalp voltage maps are displayed, showing the peak latency in the difference waveforms used to measure the MMN (top) and P3a (bottom) components for the F1/F2 deviants in the Uni-Condition (left two columns), and for the F1/F2 deviants in the Bi-Condition (middle two columns), and the I1/I2 deviants in the Bi-Condition (right two columns).