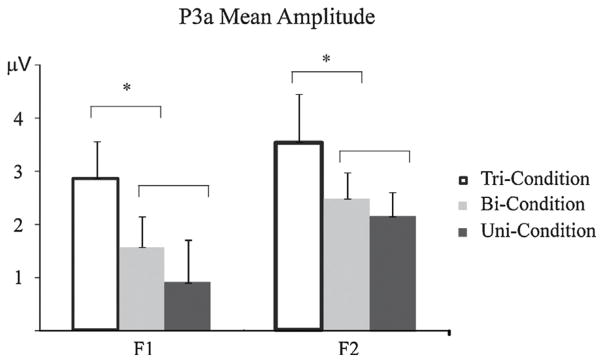
Fig. 7.

Comparisons of the P3a mean amplitudes for both experiments. F1 (left) and F2 (right) deviants elicited in the Tri-Condition (unfilled), Bi-Condition (light filled), and Uni-Condition (dark filled). Error bars denote standard error of the mean. P3a mean amplitude was calculated and is displayed for those subjects who participated in both experiments (n = 8). P3a amplitude was significantly larger in the Tri-Condition than in the Bi- and Uni-Conditions for both level frequency deviants.
