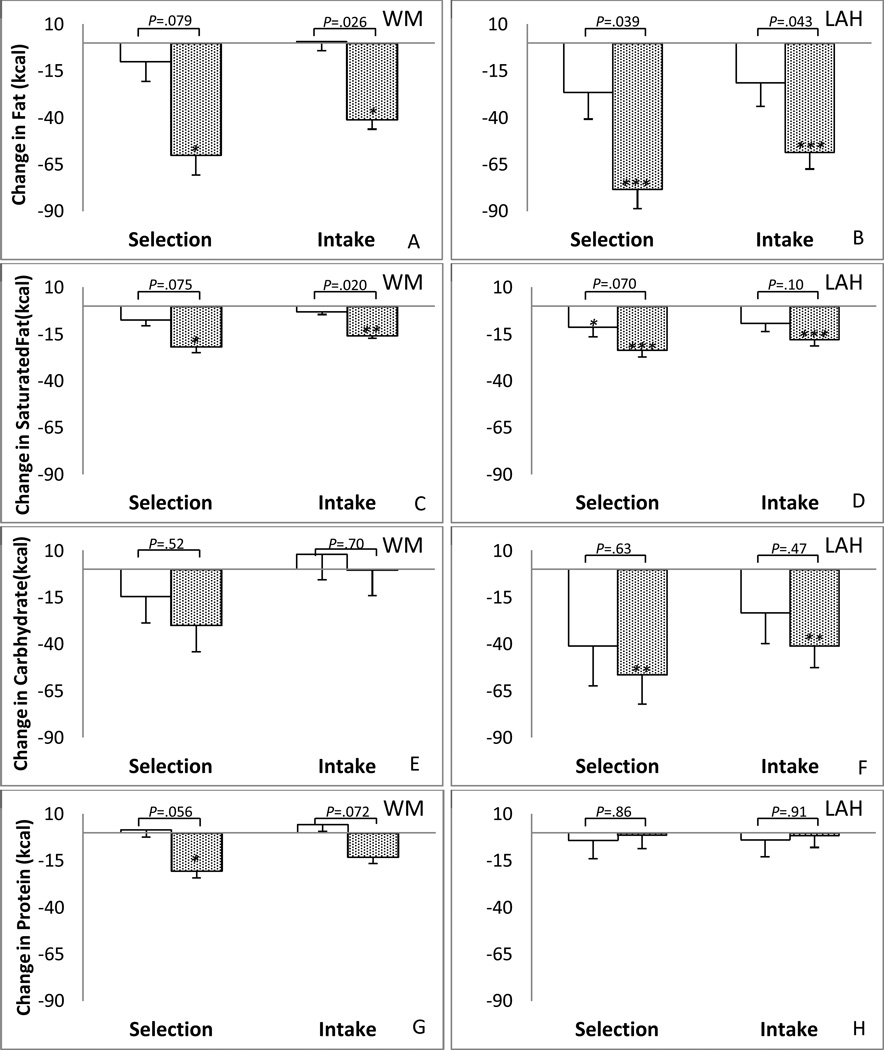
Figure 2.
Changes in food selection and food intake for macronutrients from baseline to end of study in the Wise Mind (n = 604) and LA Health (n = 2015) studies.  is for control arm and
  is for CM arm. Brackets indicate p values for differences between the two arms (CM and C) for Wise Mind (WM) and the interaction for arms by time for LA Health (LAH); * indicates p < 0.05; ** indicates p < 0.01; *** indicates p < .0001 for within-group changes from baseline to end of study.

