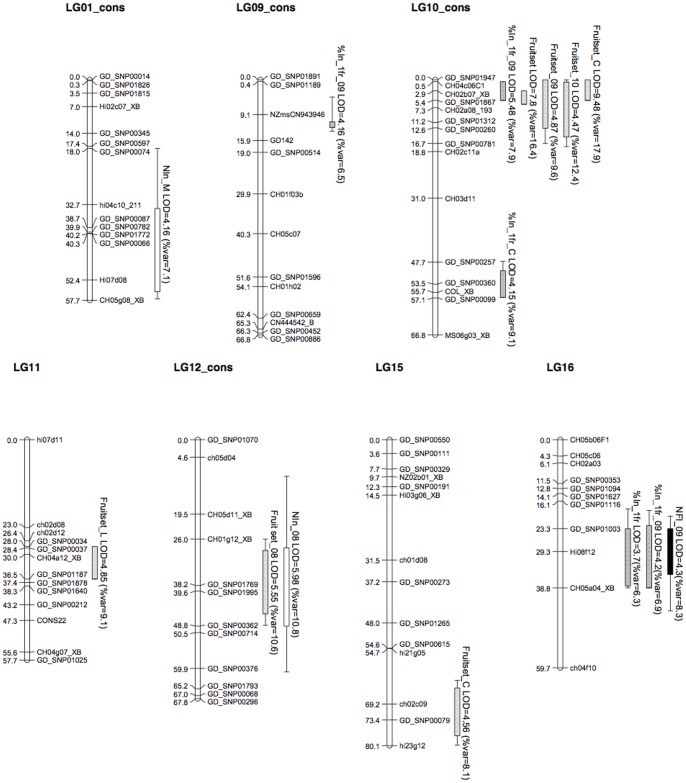
Figure 3. Genomic positions of the QTLs detected on the ‘X3263’בBelrène’ consensus map.
QTLs are represented by boxes, in which bold lines represent the LOD–1 confidence interval and extended lines represent the LOD–2 confidence interval. Boxes representing QTLs for the number of inflorescences are white, those for the number of fruits per inflorescence are black, for the fruitset traits are pale grey, and for the percentage of inflorescences with 1 fruit are dark grey. For trait abbreviations, see Table 5.

