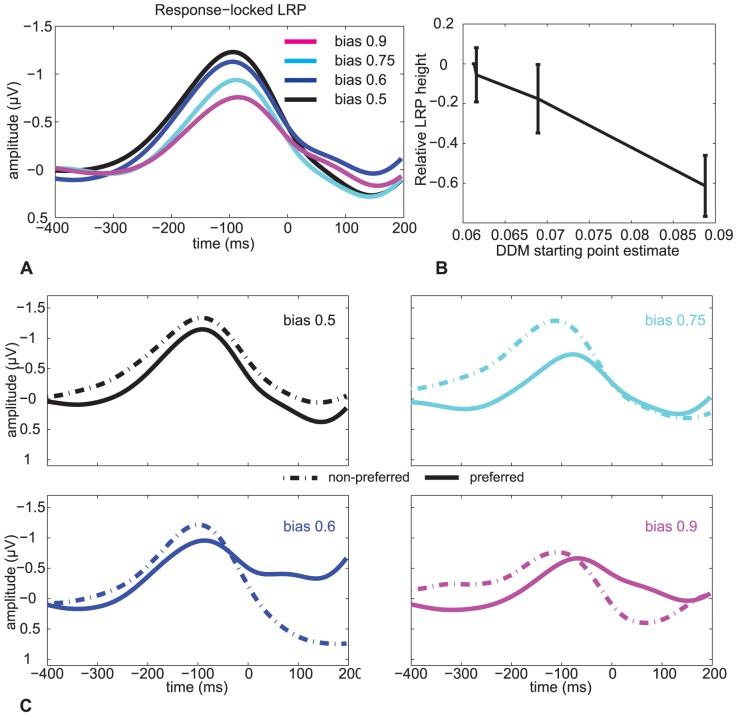
Figure 5. Response-locked LRPs in Experiment 2.
(A) Grand average LRP waveform separated by response bias (cf. Figure 1F). (B) Relationship between normalized LRP peak height and fitted DDM response bias. There is a significant correlation between the DDM starting-point parameter and LRP height. Error bars reflect sem. (C) Grand average response-locked LRPs in Experiment 2 separately for the preferred (solid) and non-preferred (dashed) direction. As predicted by our model, the LRP is larger for the non-preferred compared to the preferred direction [ = 11.4,
  ].
].

