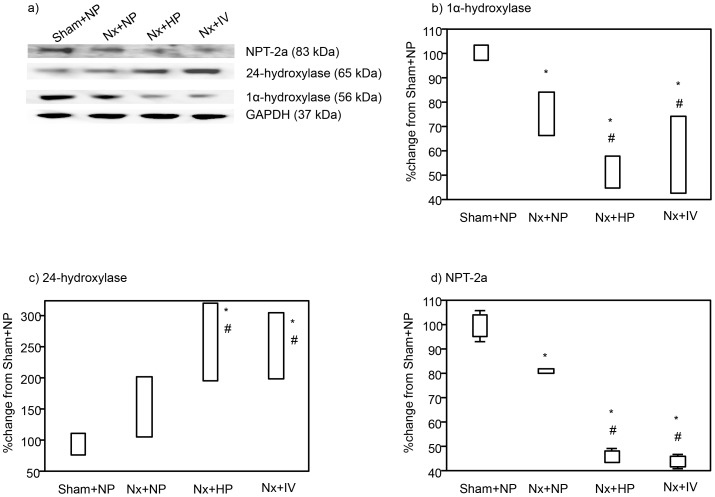
Figure 4. Immunoblotting for 1α-hydroxylase, 24-hydroxylase, NPT-2a, and glyceraldehyde-3-phosphate dehydrogenase (GAPDH) (a).
Densitometric quantification of the corresponding bands was performed using an image analyzer, 1α-hydroxylase (b) 24-hydroxylase (c), and NPT-2a (d). Data are presented after normalization to GAPDH expression and are depicted as the percentage change from the respective controls (Sham+NP). Data are shown as mean ± s.e. (n = 4 each). *P<0.05 vs. Sham+NP and #P<0.05 versus Nx+NP.

