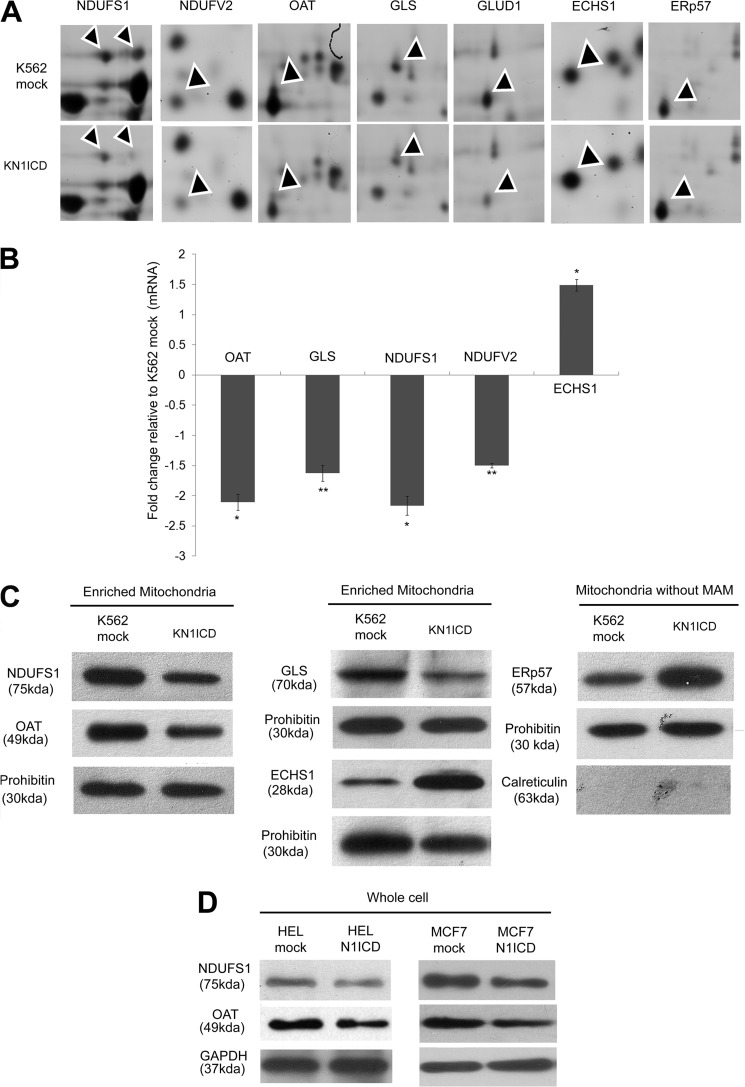
FIGURE 2.
Validation of two-dimensional DIGE data. A, segments of two-dimensional DIGE gels after Decyder analysis. The arrowheads point at the protein of interest. B, relative gene expression in K562 with constitutively activated N1ICD compared with K562 mock. The mRNA expression of the gene was normalized to the expression of HPRT1 mRNA. Data represent the mean ± S.E. *, p < 0.05; **, p < 0.01; n = 3. C, Western blot of enriched mitochondria fraction of K562 mock and KNICD showing relative expression of the altered proteins. D, Western blot of whole cell lysates from mock- and N1ICD-transfected HEL and MCF-7 cell lines showing the decrease in OAT and NDUFS1 expression.

