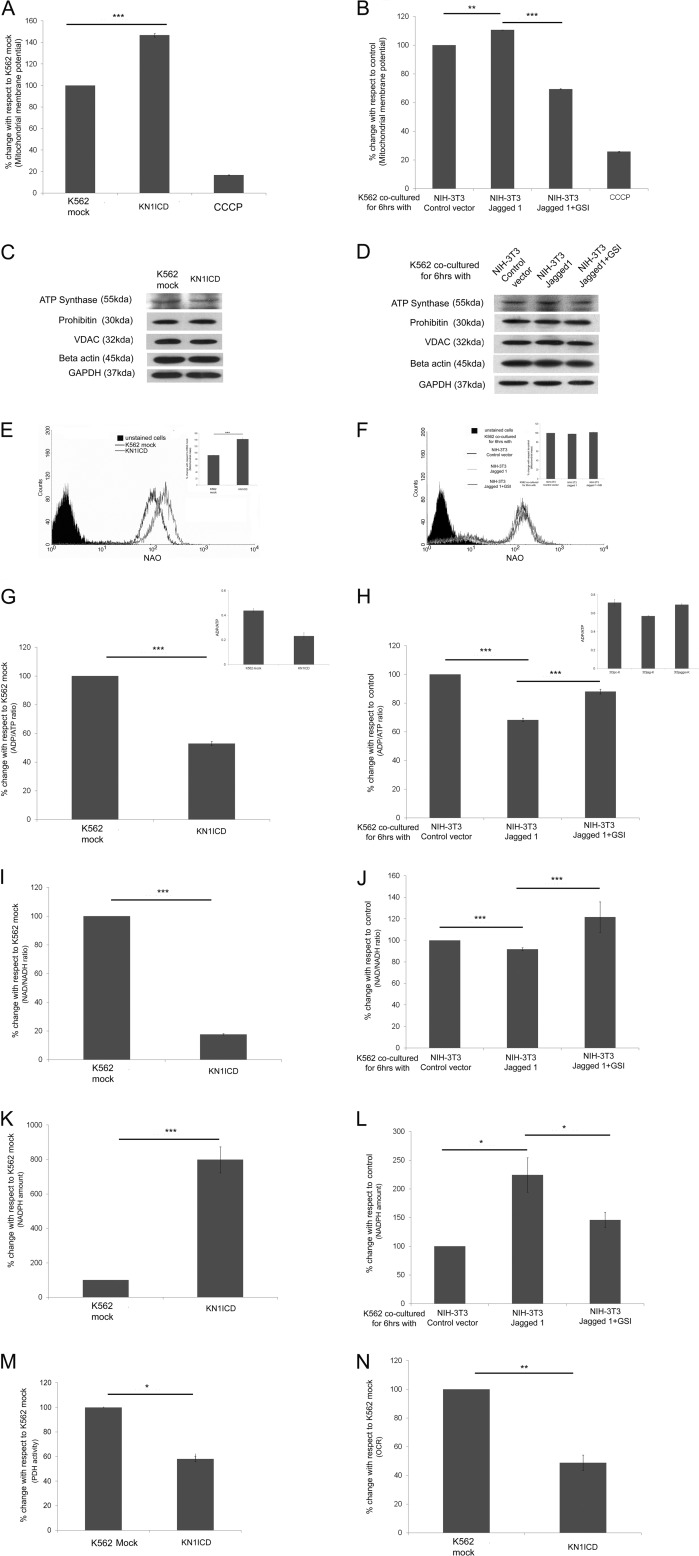
FIGURE 5.
Notch1 activation and mitochondrial function, mass, and other cellular metabolic parameters. Shown are mitochondrial membrane potential in KN1ICD (A) and in Notch induction by NIH-3T3 jagged1 (B). CCCP, carbonyl cyanide m-chlorophenylhydrazone. Shown are mitochondrial proteins from various compartments that were found to be unaltered by a two-dimensional DIGE study compared with cytoplasmic controls β-actin and GAPDH in K562 mock and KN1ICD (C) and in K562 after co-culture with NIH-3T3-empty vector, jagged1, and jagged1 + 1 μm GSI (D). Shown are mitochondrial mass measured by membrane potential independent dye nonyl acridine orange (NAO) in K562 mock (E) and KN1ICD and in K562 after co-culture with NIH-3T3-empty vector, jagged1, and jagged1 + 1 μm GSI (the inset gives the percentage change n = 3; ***, p < 0.001) (F). G, ADP/ATP ratio in K562 mock and KN1ICD (H) and in K562 after co-culture with NIH-3T3-empty vector, jagged1, and jagged1 + 1 μm GSI. The data are represented as percentage change, and the insets show the actual ADP/ATP ratio. Shown are NAD+/NADH ratios in K562 mock (I) and KN1ICD (J) and in K562 after co-culture with NIH-3T3-empty vector, jagged1, and jagged1 + 1 μm GSI. Shown are NADPH amounts per μg of protein in K562 mock (K) and KN1ICD (L) and in K562 after co-culture with NIH-3T3-empty vector, jagged1, and jagged1 + 1 μm GSI. M, percentage PDH activity of KNICD with respect to K562 mock (*, p < 0.05). N, -fold change in oxygen consumption rate (OCR) in KN1ICD measured in nmol/min/cell with respect to K562 mock.

