FIGURE 2.
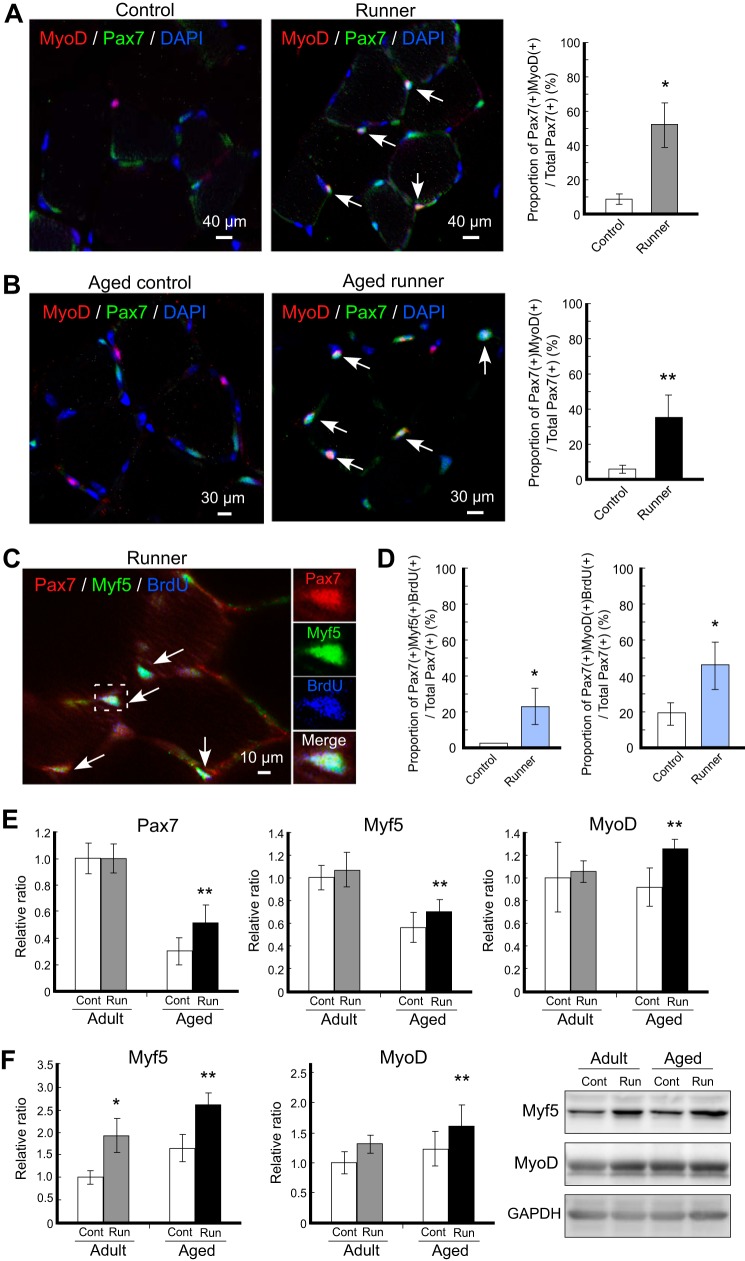
Activation of satellite cells following voluntary wheel running. A and B, immunohistochemistry analysis of satellite cells following exercise. Representative merged images of immunohistochemistry staining for MyoD (red) and Pax7 (green) with DAPI from adult (A) and aged mice (B) are shown. Left panels are from the control group, and right panels are from the runner group. The proportions of Pax7+MyoD+ cells per total Pax7+ cells are shown in the right graph. White arrows indicate Pax7+MyoD+ cells. C, representative merged images of immunohistochemistry staining for Pax7 (red), Myf5 (green), and BrdU (blue) from the adult runner group. Magnification of the area surrounded by the dashed square is shown in the right panels, and white arrows indicate Pax7+MyoD+BrdU+ cells. D, proliferative activated satellite cells increased following exercise. The proportion of Pax7+MyoD+BrdU+ cells per total Pax7+ cells in each group was plotted. E and F, expression profiles of stem cell markers of satellite cells. The mRNA expression levels of satellite cells markers (Pax7, left; Myf5, center; MyoD, right) in gastrocnemius were detected by qRT-PCR (E). The protein expression levels of Myf5 (left graph) and MyoD (right graph) in gastrocnemius were detected by Western blot. The right images represent the typical blot patterns of Myf5 (upper), MyoD (middle), and GAPDH (lower) (F). In all graphs, signals are represented by white bars (controls (Cont) in adult and aged mice), gray bars (adult runner (Run) mice), and black bars (aged runner mice). The mRNA and protein values were normalized to that of GAPDH and then plotted as the expression ratio relative to the control sample in adult mice. All data are expressed as the mean ± S.D. (n = 4/group). Significant differences are as follows: *, compared with adult control group; **, compared with aged control group (p < 0.05).

