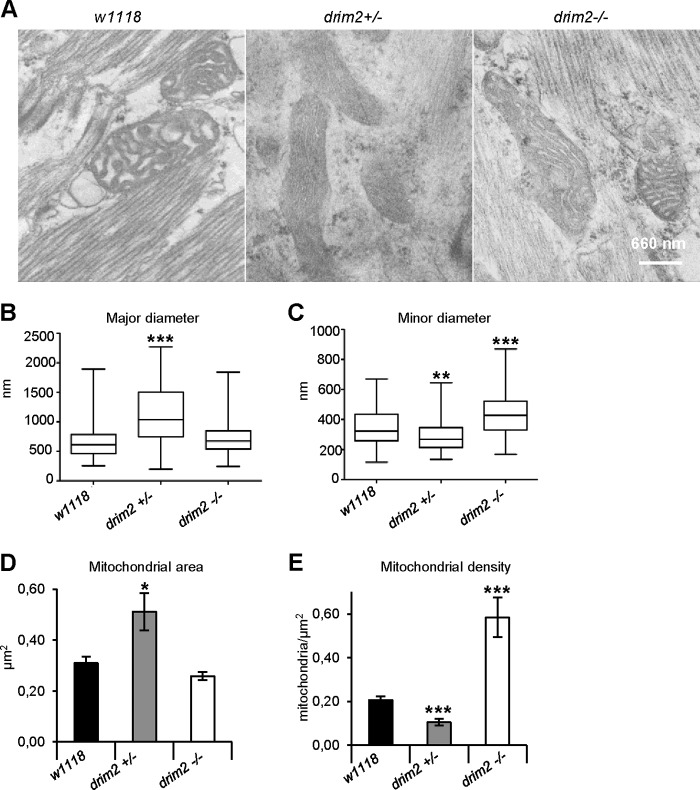
FIGURE 6.
Electron microscopic analysis on third stage larval body wall sections. Characterization was carried out on w1118, drim2+/−, and drim2−/− larvae. A, cross-sectional ultrastructure of larval muscles, illustrating the distribution and morphology of mitochondria. B and C, morphometric analyses of mitochondrial dimensions in terms of minor (B) and major diameter (C), both expressed in nanometers and presented as box plots. D, mean ± S.E. of the total area occupied by mitochondria (expressed in square microns) over the tissue profile area measured (w1118, 447 μm2; drim2+/−, 231 μm2; drim2−/−, 256 μm2). E, mitochondria density ± S.E. was plotted as the number of mitochondria per square micron of the tissue profile area (w1118, 447 μm2; drim2+/−, 231 μm2; drim2−/−, 256 μm2) (Student's t test *, p < 0.05; **, p < 0.01; ***, p < 0.005).

