
FIGURE 8.
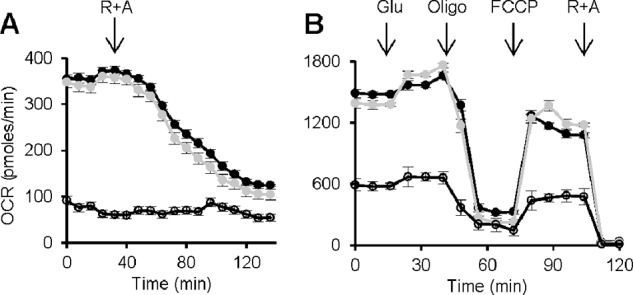
Oxygen consumption rates in larvae and in S2R+ cells. A, oxygen consumption was measured in w1118 (black vehicles), drim2+/− (gray vehicles), and drim2−/− (empty vehicles) third stage larvae. The addition of 5 μm rotenone (R) plus 5 μm antimycin A (A) is indicated by the arrow. B, respiratory profile of control and drim2-silenced S2R+ cells. We analyzed untreated cells (black vehicles), cells silenced for 48 h with dsRNA (gray vehicles), and cells silenced for 96 h (empty vehicles). Ten mm glucose (Glu), 1 μm FCCP, and 5 μm rotenone plus 5 μm antimycin A were added at the times marked by arrows.