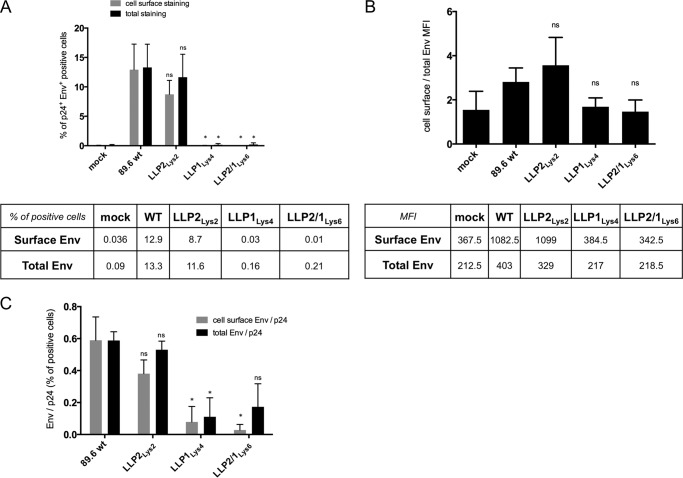
FIGURE 6.
Expression of Env at the cell surface and in the cells. CEMx174 cells were infected with equal amounts of p24 of WT or mutated viruses. At 9 days post-infection the cells were stained with SAR1 anti-Env antibodies and then permeabilized for p24 staining (cell surface Env analysis) or permeabilized prior staining with both SAR1 anti-Env and anti-p24 antibodies (total Env analysis). Data represent two independent experiments. Statistical analyses were performed for the mutated relative to the wild type Env (ns, non significant; *, p < 0.05). A, percentage of Env expression in p24-positive cells. Gated live cells were analyzed for the percentages of p24-positive and cell surface or the total Env positive population for each mutant, indicated on the y axis. The corresponding percentage data are shown in the table below and represent the average of two independent experiments. B, mean fluorescence intensity of Env positive cells expressed at the cell surface normalized to the mean fluorescence intensity of Env expressed in the cells. Corresponding mean fluorescence intensity data are shown in the table below and represent the average of two independent experiments. C, relative expression of Env per infected cells. The percentage of cell surface or total Env positive cells was normalized to the percentage of p24 positive cells. The data represent the average of two independent experiments.

