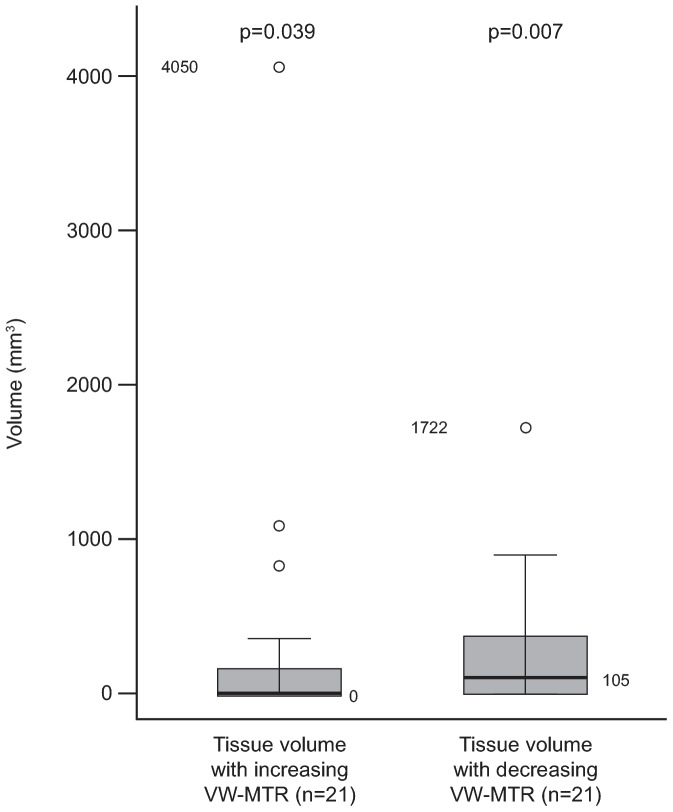
Figure 4. Difference from baseline to 24 weeks for increasing and decreasing VW-MTR in T2-LV in patients.
The p-value is for the difference from zero within groups from the Wilcoxon signed–rank test with adjustment. In the box plot, the bold line represents the median; the boxes represent the middle 50% of data; the top and bottom of the box represent the third and first quartiles; the open circles are outliers. The whisker lines above and below the boxes represent the largest and smallest values that are not considered to be outliers. LV, lesion volume; NS, not significant; VW-MTR, voxel-wise magnetization transfer ratio.

