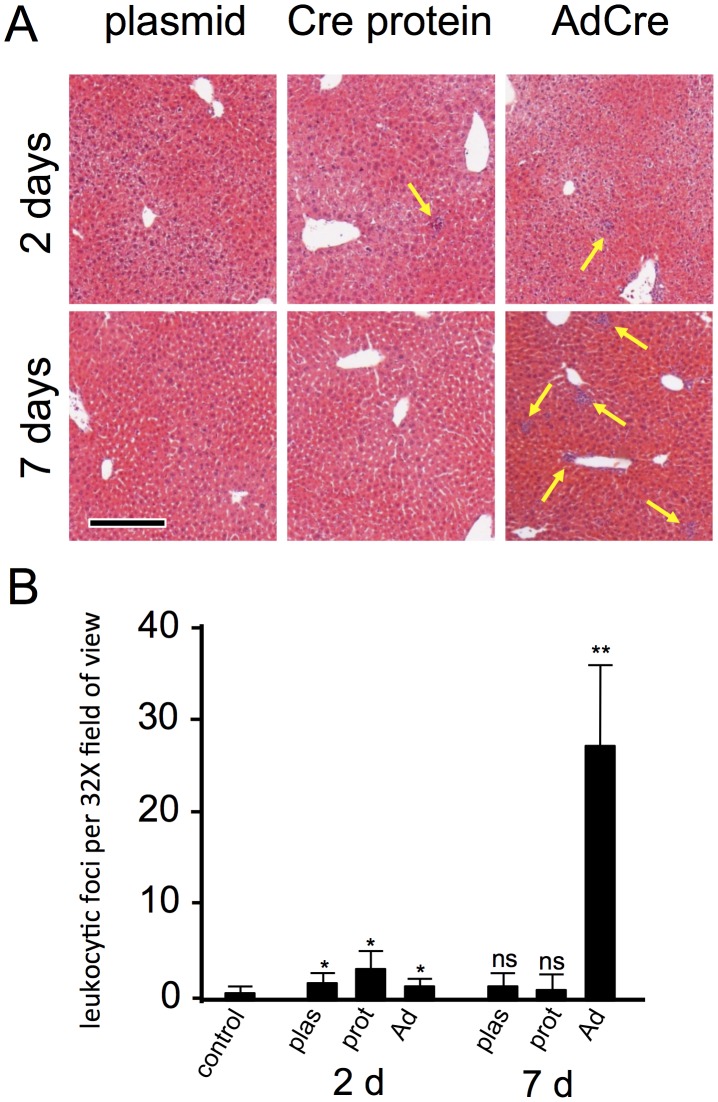
Figure 5. Hepatic inflammation following hydrodynamic delivery of pMC1-Cre or Cre protein, or non-hydrodynamic delivery of AdCre vector.
Mice were uninoculated (control), were inoculated hydrodynamically with 25 µg of pMC1-Cre protein or 2 nmol of Cre protein, or they received 2×10⁶ PFU of CsCl-purified AdCre vector retroorbitally, as indicated. Mice were harvested 2 or 7 days later and H&E paraffin sections were evaluated for the number of leukocytic foci per field of view at 32× magnification (av. 8.5×10³ hepatocytes/field). Representative foci are indicated by yellow arrows in panel A. Scale bar 100 µmeters. Note, frames in panel A were taken at 100× to better reveal the leukocytic foci, and therefore contain only (3.2) − 2, or ∼ 9%, as many cells or leukocytic foci as those quantified in paned B. Quantitative data are presented in panel B. *, P≤0.05 compared to control; **, P≤0.05 compared to control; ns, not significantly different than control. The three conditions did not differ significantly from each other at 2 d.

