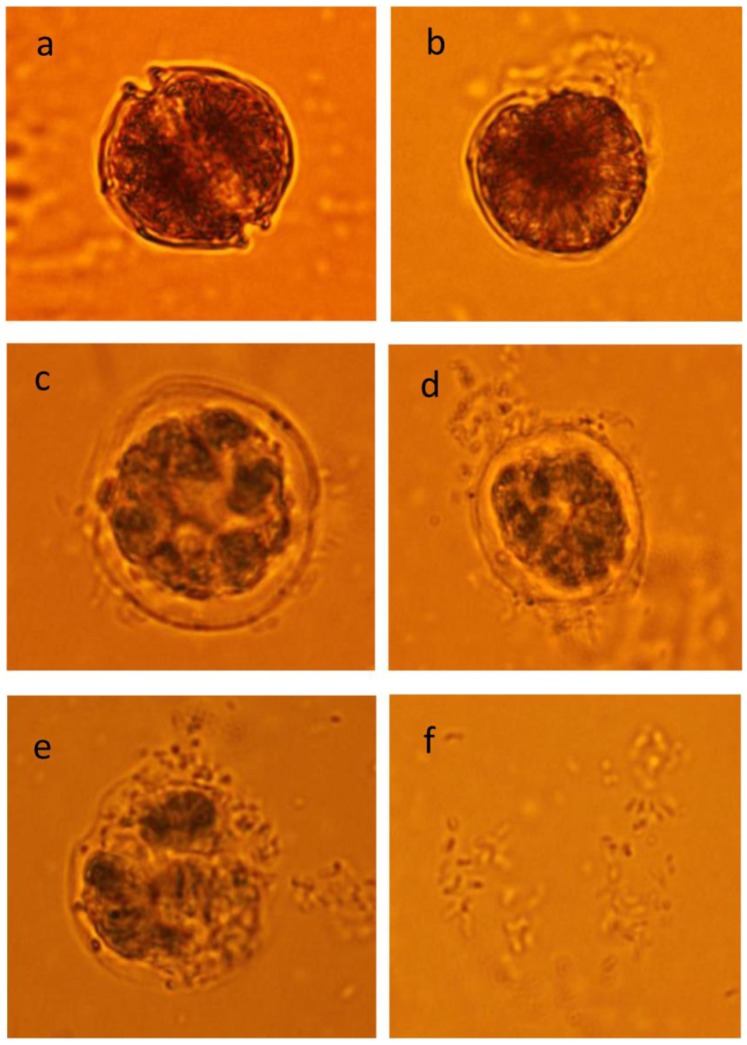
Figure 7. The effects of palmitoleic acid on A. tamarense (40 μg/mL).
(a) control cells of A. tamarense treated with AC1 broth; (b) cells treated with palmitoleic acid on the first day; (c) cells treated with palmitoleic acid after 2 d; (d) cells treated with palmitoleic acid after 3 d; (e) cells treated with palmitoleic acid after 4 d; (f) cells treated with palmitoleic acid after 5 d; (×100).

