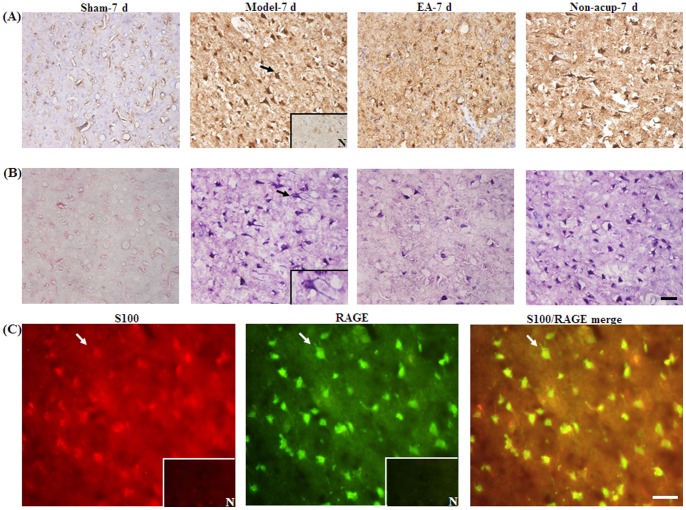
Figure 4. Effects of EA at acupoints on S100B, GFAP/S100B expression, and S100/RAGE expression in the ischemic cortical penumbra.
Representative photographs show (A) S100B- and (B) GFAP/S100B-immunoreactive cells in the ischemic cortical penumbra in the Sham-7 d, Model-7 d, EA-7 d, and Non-acup-7 d groups 7 d after reperfusion. (C) Representative photographs show S100-, RAGE-, and S100/RAGE-immunoreactive cells in the ischemic cortical penumbra 7 d after reperfusion. N, negative control. The black arrows in (A) and (B) indicate S100B (brown)- and GFAP/S100B (purple)-immunoreactive cells, respectively. The bottom-right panel shows a GFAP/S100B double-labeled cell at a higher magnification, indicated by a black arrow. The white arrows in (C) indicate S100 (red)-, RAGE (green)-, and S100/RAGE (yellow-green)-immunoreactive cells. Scale bar = 50 µm.

