Figure 2.

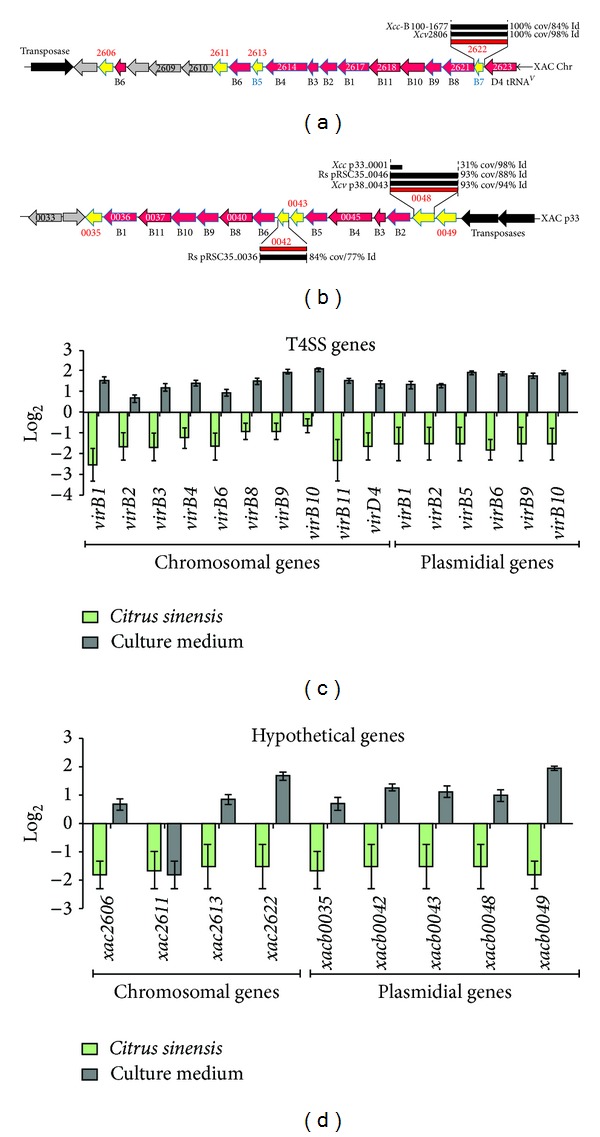
T4SS genes in Xanthomonas citri subsp. citri and their expression levels. Schematic representation of T4SS genes in Xanthomonas citri subsp. citri and their expression levels. (a) and (b) show functional maps of T4SS genes on the chromosome (a) and plasmid pXAC64 (b), respectively. The expression levels of genes in the T4SS (c) and ORFs localized near the virB genes (d) are indicated. Solid green bars indicate in vivo expression with respect to their expression in vitro (black bars). Error bars indicate standard deviation of the replicates.
