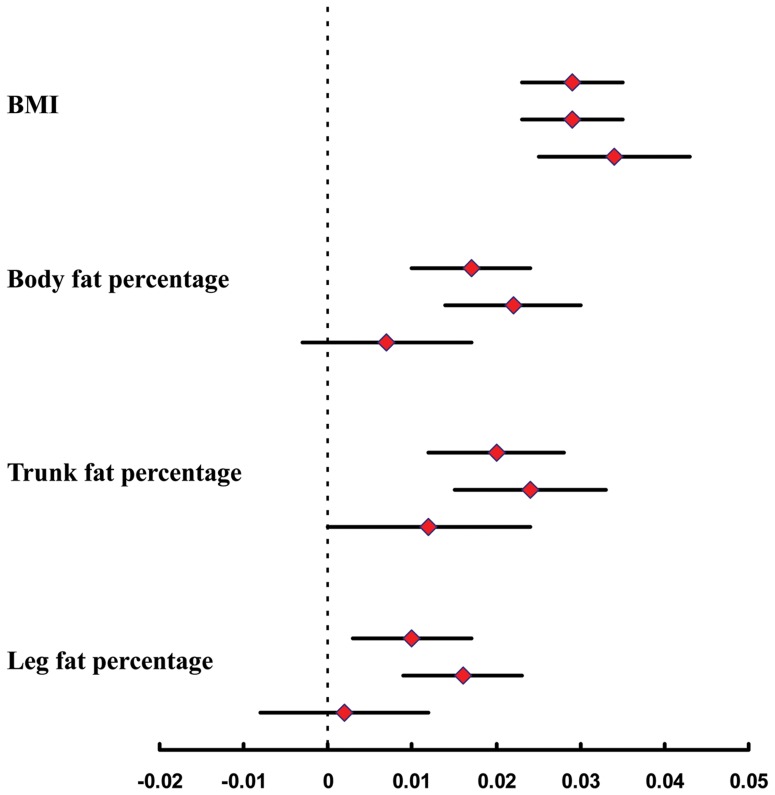
Figure 2. The associations of overall GRS, EA GRS and EAA GRS with adiposity traits.
Figure shows the effects of overall GRS (top estimate), EA GRS (middle estimate), and EAA GRS (bottom estimate) on inverse normal transformed BMI, body fat percentage, trunk fat percentage, and leg fat percentage in our population.

