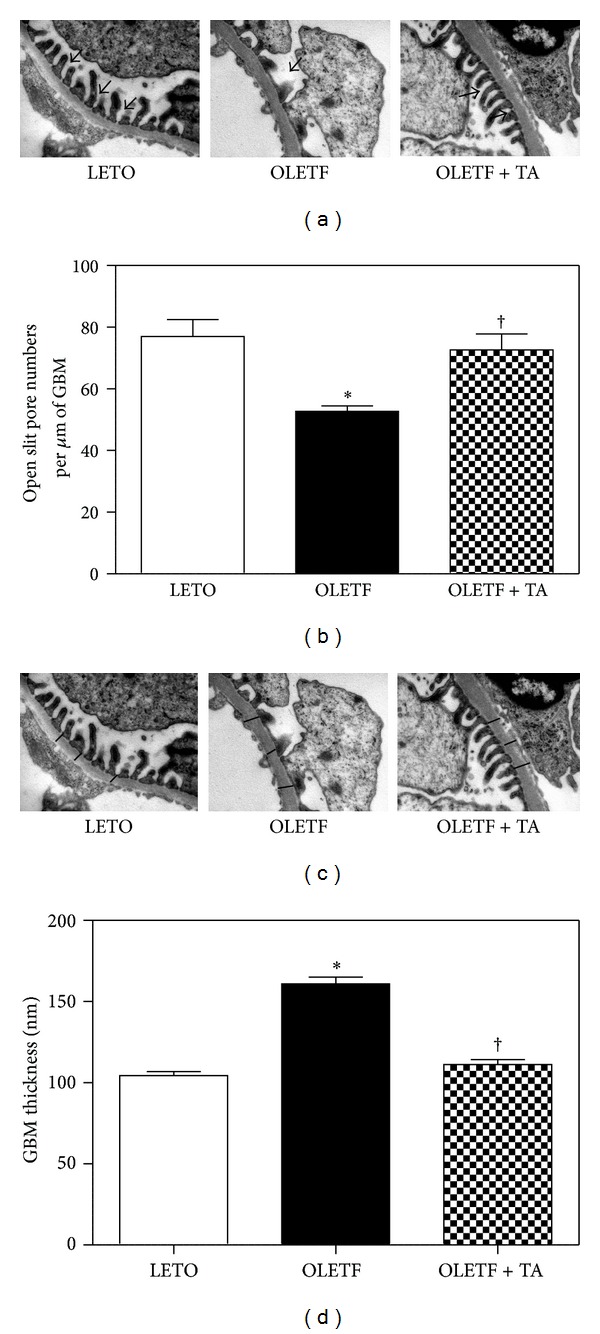
Figure 3.

Changes in the numbers of open slit pores and GBM thickness among the three groups. (a) Electron microscopy demonstrated open slit pores (arrows) between the foot processes of the podocytes (×30 K). (b) The numbers of open slit pores significantly increased following taurine treatment when compared to the diabetic control group. (c) Electron microscopy revealed the GBM thickness. Arrows indicate the thickness of the GBM (×30 K). (d) The taurine-treated diabetic group had significantly decreased GBM thickness compared to the diabetic control group. GBM, glomerular basement membrane; LETO, normal control group; OLETF, diabetic control group; OLETF + TA, taurine-treated diabetic group. Data are expressed as mean ± SEM. *P < 0.05 compared with LETO; † P < 0.05 compared with OLETF.
