
Figure 4.
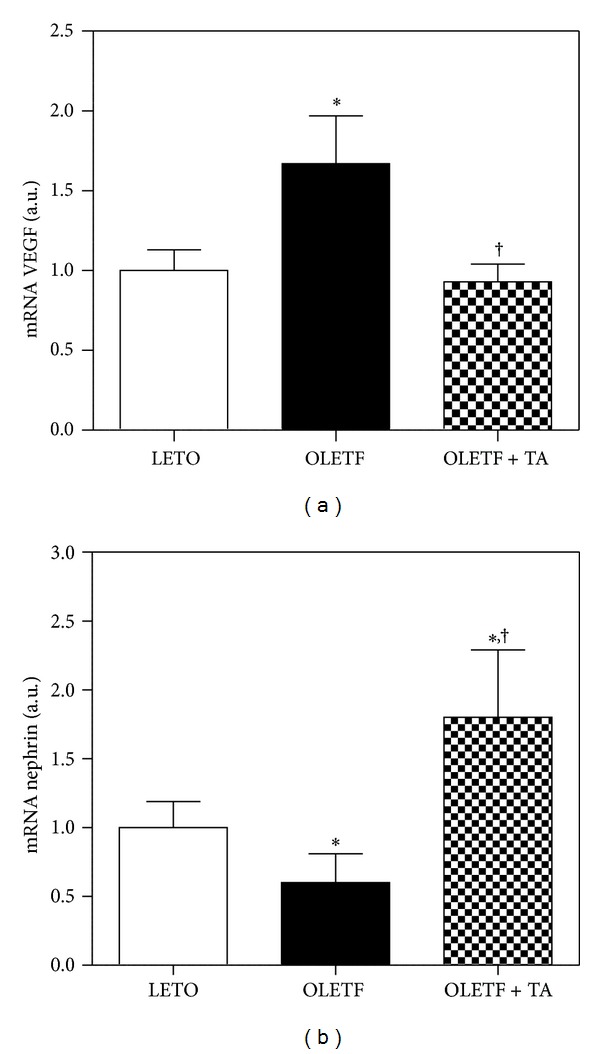
Differences in VEGF and nephrin mRNA expression in the kidney. (a) Renal VEGF mRNA expression decreased in the taurine-treated diabetic group compared to the diabetic control group. (b) Renal nephrin mRNA expression increased in response to taurine treatment. LETO, normal control group; OLETF, diabetic control group; OLETF + TA, taurine-treated diabetic group. Data are expressed as mean ± SEM. *P < 0.05 compared with LETO; † P < 0.05 compared with OLETF.