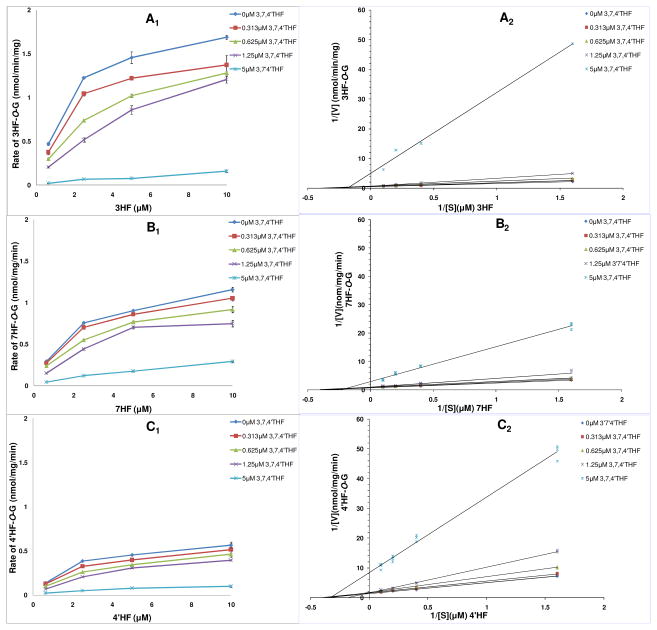
Figure 3.
Kinetics profiles (left) and Lineweaver-Burk (double-reciprocal) plots (1/V versus 1/[S]) (right) of UGT1A1-mediated glucuronidation of 3HF (A, 3HF-O-G), 7HF (B, 7HF-O-G) and 4′HF (C, 4′HF-O-G) in the presence of different concentrations of 3,7,4′THF, respectively. Concentrations of the substrate 3HF, 7HF, 4′HF were 0.625, 2.5, 5 and 10 μM. Concentrations of the inhibitor 3,7,4′THF were 0, 0.313, 0.625, 1.25 and 5 μM. Each data point represents the average of three determinations. The corresponding ampliative Lineweaver-Burk plots at lower 3,7,4′THF concentrations (0, 0.313, 0.625, 1.25 μM) see Figure S2 (SI). Each plot represents the mean of duplicate measurements.

