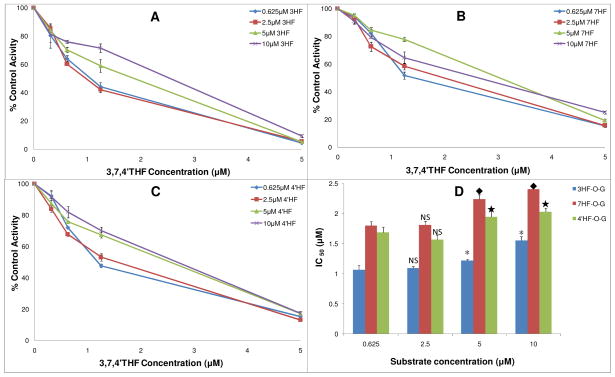
Figure 4.
Concentration-dependent inhibitory effects (IC50) of 3,7,4′THF on UGT1A1- mediated glucuronidation of 3HF, 7HF and 4′HF. A, B, C were inhibition (IC50) profiles of 3,7,4′THF on 3HF-O-G, 7HF-O-G and 4′HF-O-G formation at different concentrations of the substrates 3HF, 7HF and 4′HF, respectively. The IC50 values are expressed as percentages relative to the control, which was determined in the absence of 3,7,4′THF. D was the corresponding column plot summarizing the resulting IC50 values. *, ◆, ★, Significantly different (p < 0.05) from IC50 values at 0.625 μM concentration of the substrates 3HF, 7HF and 4′HF, when compared to those at 2.5, 5, or 10 μM substrate concentrations, respectively. IC50 values showed no significant difference between 0.625 μM to 2.5 μM of the substrate concentrations. Concentrations of the substrate 3HF, 7HF and 4′HF were 0.625, 2.5, 5 and 10 μM, respectively. Concentrations of the inhibitor 3,7,4′THF were 0, 0.313, 0.625, 1.25, 5 μM. Each data point represents the average of three determinations.

