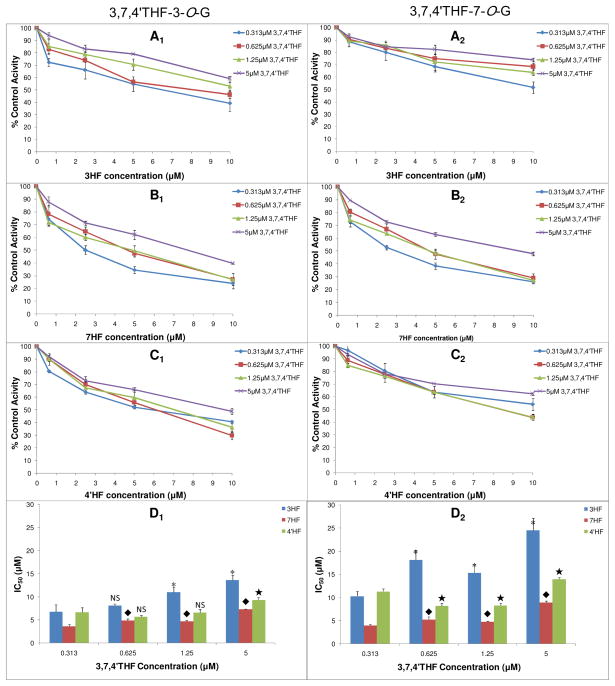
Figure 7.
Concentration-dependent inhibitory effects (IC50) of 3HF, 7HF and 4′HF on UGT1A1-mediated glucuronidation of 3,7,4′THF. A1, B1, C1 were the inhibition (IC50) profile of 3HF, 7HF and 4′HF on 3,7,4′THF-3-O-G formation at different substrate concentrations, respectively. A2, B2, C2 were the inhibition (IC50) profile of 3HF, 7HF and 4′HF on 3,7,4′THF-7-O-G formation at different substrate concentrations, respectively. The values are expressed as percentages relative to the control, which was determined in the absence of 3HF, 7HF and 4′HF. D1 and D2 were the corresponding column plots summarizing the resultant IC50 values. *, ◆, ★, Significant difference (p < 0.05) from IC50 value at 0.313 μM 3,7,4′THF concentration, when compared to those at 0.625, 1.25, or 5 μM substrate concentrations, respectively. IC50 values of 3HF showed no significant difference between 0.313 μM and 0.625 μM substrate concentration (formation of 3,7,4′THF-3-O-G). IC50 values of 4′HF showed no significant difference between 0.313 μM and 1.25 μM substrate concentration (formation of 3,7,4′THF-3-O-G). Concentrations of the substrate 3,7,4′THF were 0.313, 0.625, 1.25, 5 μM. Concentrations of the inhibitor 3HF,7HF and 4′HF were 0, 0.625, 2.5, 5, 10 μM, respectively. Each data point represents the average of three determinations.

