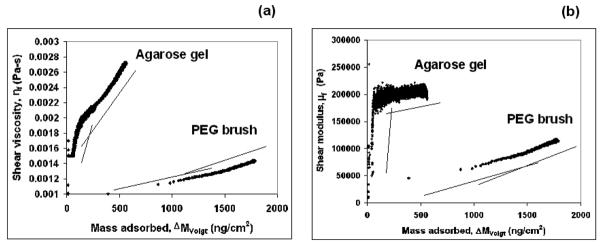
Fig. 5.

Variation in (a) shear viscosity, ηf, and (b) shear modulus, μf, as a function of mass adsorbed as calculated by the Voigt model, ΔMVoigt, at 24.0 ± 0.1°C. The lines are used to indicate the changes in slope due to coverage-induced changes in structure of the adsorbed molecules. dq = 3.34 × 10⁻⁴ m; ρq = 2650 kg/m3; ρl = 1000 kg/m3 and ηl = 0.001 Pa.s.39
