Figure 1.

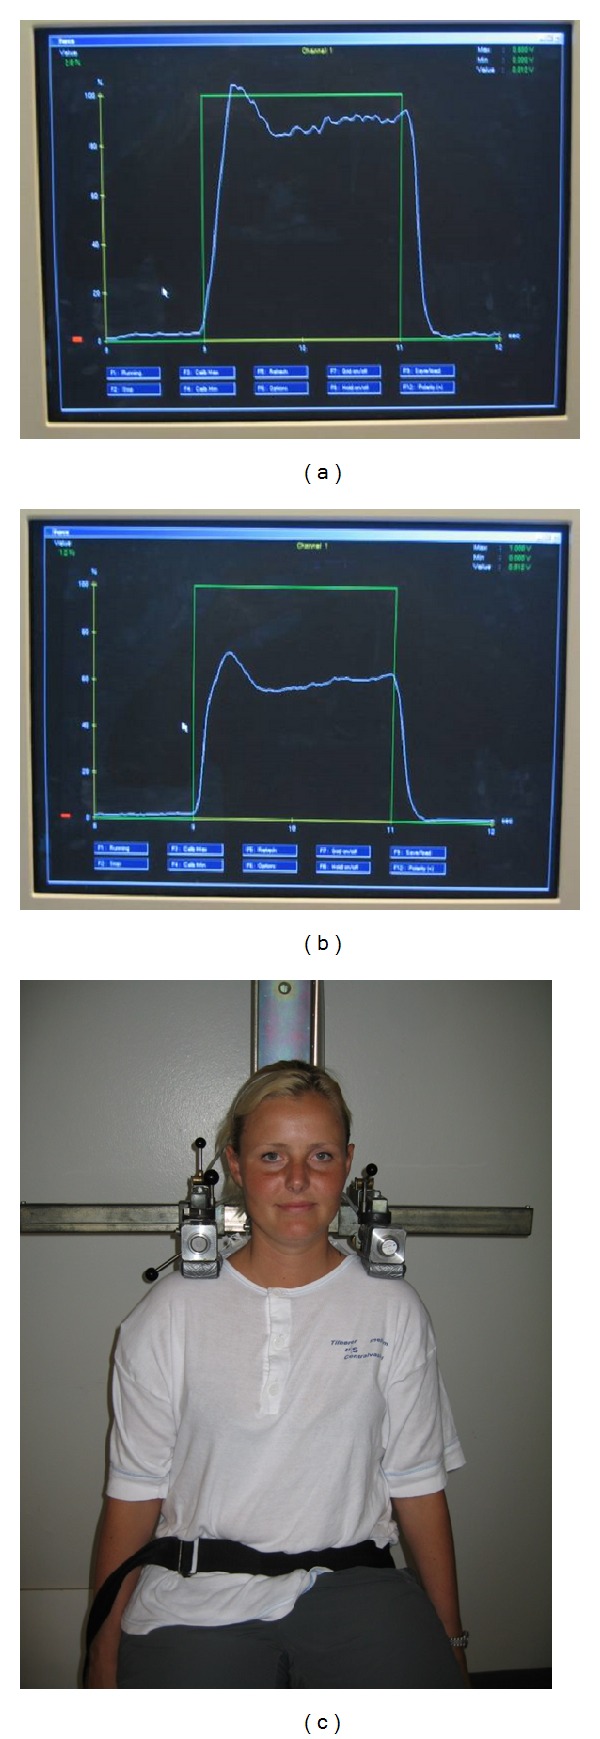
Illustration of experimental setup, the square wave signal (green tracing), and a typical force signal (white tracing) in the beginning (left) and during the end (right) of the 100 consecutive contractions.

Illustration of experimental setup, the square wave signal (green tracing), and a typical force signal (white tracing) in the beginning (left) and during the end (right) of the 100 consecutive contractions.