Figure 1.
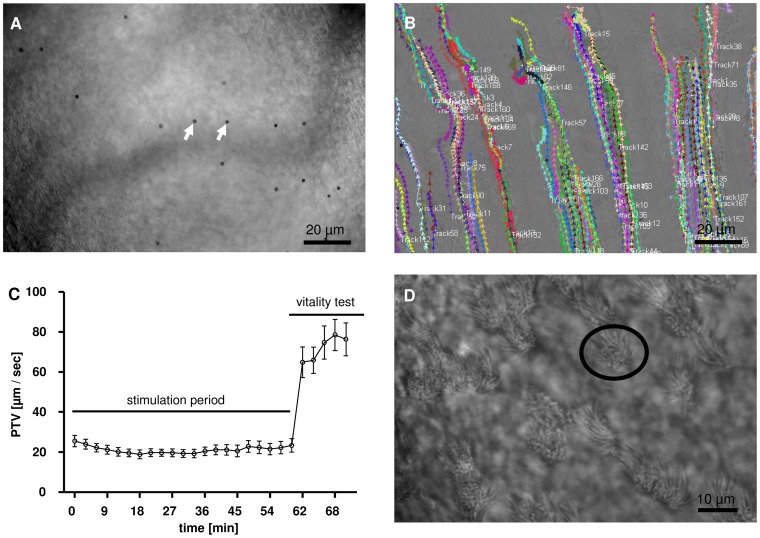
A, B: Microscopy for PTV measurements. Section of microscopic top view on the tracheal epithelium between 2 cartilages for PTV measurement (20x lens). A: Arrows indicate the applied particles (Dynabeads) B: Recorded particle tracks for PTV calculation. C: Representative experimental setup: The stimulation phase started 60 minutes after organ explantation. Measurements were performed over a period of 60 minutes (stimulation period). Vitality of the ciliary cells was tested by ATP application (10−5 M) over 10 minutes (vitality test) (Control group, n = 5, Mean ± S.E.M). D: Microscopy for CBF measurements. Section of microscopic top view between 2 cartilages for CBF measurement (40x lens). Encircled area shows cilia bearing epithelial cell.

