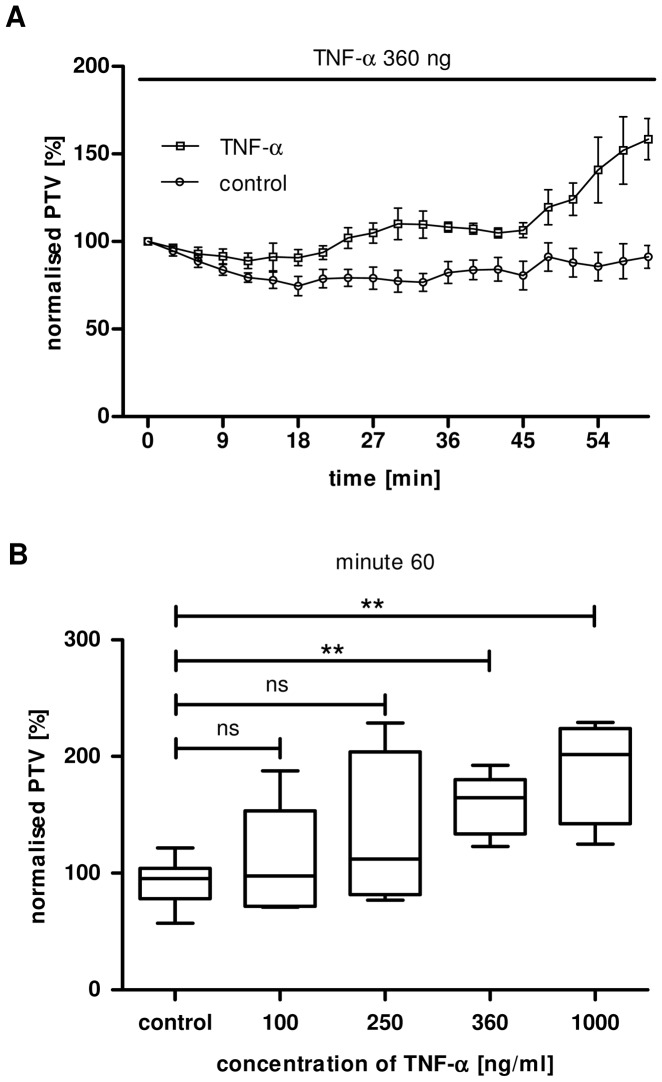
Figure 2.
A: TNF-α induced increase in PTV. Exposure to TNF-α (360 ng/ml) induced an increase in PTV with a delay of approximately 24 min, the increase in PTV was already significant after 30 min of application (p<0.05). After a brief plateau in which the increased PTV did not reach the threshold of statistical significance, it further rose, still in the presence of TNF-α, from minute 51. It eventually reached its maximum between 51 and 60 minutes after TNF-α application (p<0.001, vitality test not shown, TNF-α: 360 ng/ml, n = 5, Mean ± S.E.M.). B: Concentration dependency of TNF-α induced PTV. Cilia driven PTV is shown during the application of TNF-α at minute 0. Application of TNF-α 100 ng/ml (n = 9) or 250 ng/ml (n = 4) showed a trend to enhance cilia driven PTV compared to control (n = 9; p = 0.4). The PTV increased significantly until minute 60 during continuous stimulation with 360 ng/ml TNF-α (n = 5, p<0.01, compared to control) or 1000 ng/ml (n = 4, p<0.01, compared to control, Mean ± S.E.M.) Kolmogorow-Smirnow-test followed by Mann Whitney U-test.

