
Fig. 1.
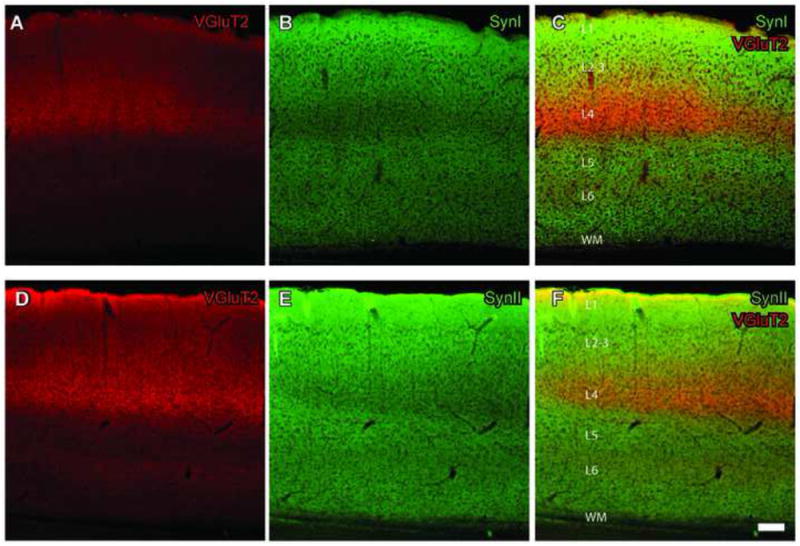
SynI and SynII staining patterns in visual cortex are interdigitated with that of VGluT2. A, VGluT2 staining using a Cy5 coupled secondary antibody. A strong band of staining appears in Layer 4. B, Image of SynI staining using a Cy2 coupled secondary antibody. A band of weaker staining corresponds to Layer 4. C, Merged images with both SynI and VGluT2 labeling. D,E, VGluT2 staining as in (A), but staining with VGluT2 (Cy2 secondary) and SynII (Cy3 secondary) on a slice fixed with GA-containing fixative. Similar to SynI, staining intensity is the weakest in Layer 4. F, Merged images with both SynII, and VGluT2 labeling. Scale bar = 100μm (applies to all panels).