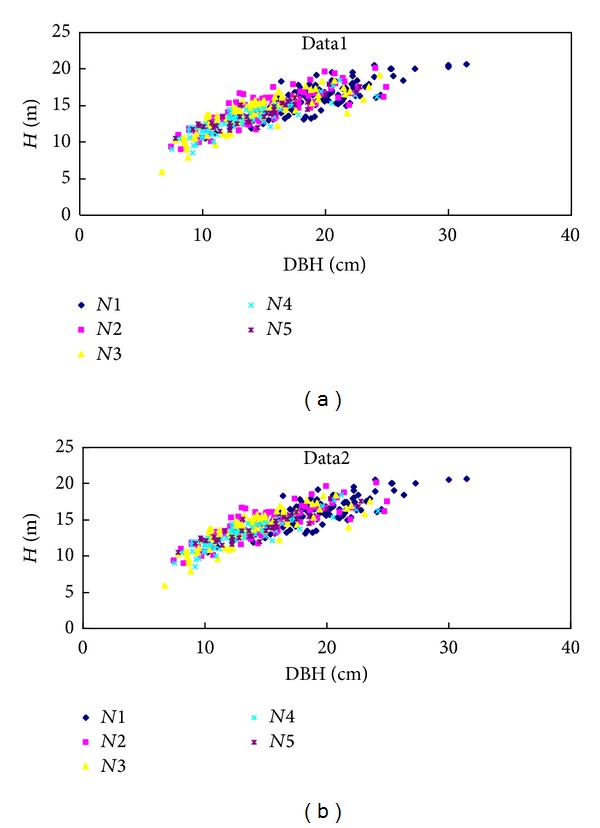
Figure 2.

Scatter plot of tree height (H) against diameter at breast (DBH) for different densities. N1 = 2 m × 3 m (1667 trees/ha), N2 = 2 m × 1.5 m (3333 trees/ha), N3 = 2 m × 1 m (5000 trees/ha), N4 = 1 m × 1.5 m (6667 trees/ha), and N5 = 1 m × 1 m (10,000 trees/ha).
