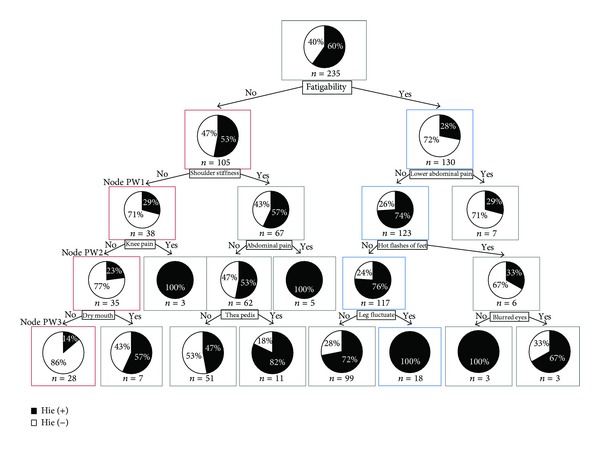
Figure 1.

CART of postmenopausal women by hie related symptoms and findings. The root node of Figure 1 indicates that there were 235 total observations (n = 235), and the black part of the pie chart means 60% of “n,” who have had an episode of hie (hie(+)). And the white part of the pie chart means 40% of “n,” who have not had an episode of hie (hie(−)). Each node below the root node has the same meaning.
