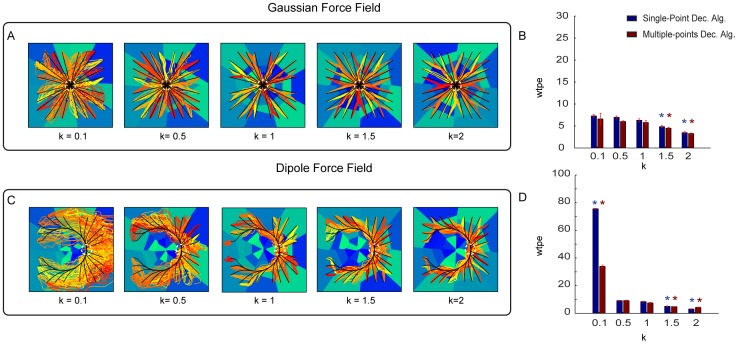
Figure 8. Performances of the ndBMI by using a data set generated from a Gamma Interval process with different values of the shape parameter k.
(A, C) Ideal ad actual trajectories superimposed to the sensory regions obtained by using data generated by using five different values of the shape parameter  of a Gamma interval process used to set the inter-spike intervals of the simulated spike trains. We ran the interface using the Gaussian (A) and Dipole (C) force fields with the Multiple-points algorithm. (B, D) Average within-trajectory position error across the three different conditions shows how the error decreases by increasing the regularity of the spiking of the M1 neurons. The * denotes that wpte depended significantly on
  (
( one-way ANOVA) and is placed in correspondence of the values of
  for which wpte was significantly different from the “reference” condition with
  (Tukey hsd
  ).
).

