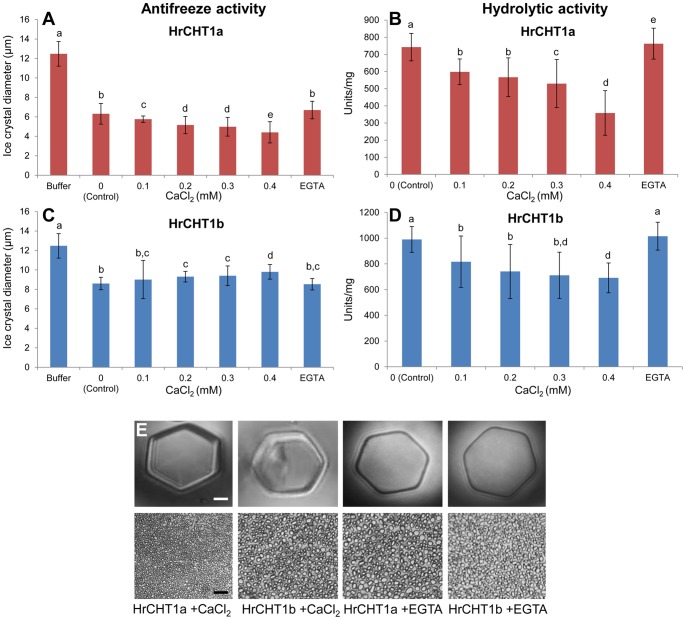
Figure 6. Analysis of effect of calcium on HrCHT1a and HrCHT1b.
Effect of calcium on hydrolytic (A) and antifreeze activities (B, C) of HrCHT1a and HrCHT1b. Lower values of ice crystals diameter represent higher ice recrystallization inhibition and thus higher antifreeze activity. Error bars show standard deviation from three replicates. Statistical significance was determined by one-way ANOVA followed by Tukey−Kramer multiple comparisons test. Values with the same letters are not significantly different (p>0.05). Magnification bar in nanoliter osmometry shows 10 µm, while in splat assay it represents 50 µm.

