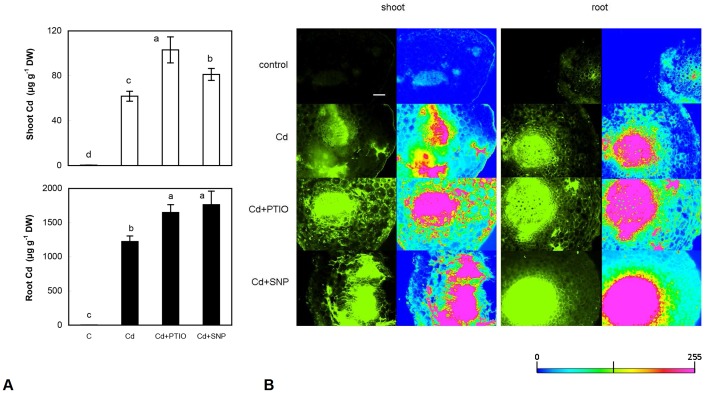
Figure 1. Accumulation of cadmium in chamomile plants (A) and visualization of Cd on freshly-prepared hand-made cross sections from petioles (shoot) and primary roots (root) using Phen Green SK diacetate (B) after 48 h of exposure to Cd alone (60 µM) or with the addition of 2-phenyl-4,4,5,5-tetramethyl-imidazoline-1-oxyl-3-oxide (PTIO, 60 µM) and sodium nitroprusside (SNP, 300 µM).
Data are means ± SDs (n = 4) for Cd content and three sections were stained for Cd (representative is shown). Values within individual graphs followed by the same letter(s) are not significantly different according to Tukey’s test (P<0.05). Shoot means whole above-ground biomass for Cd content; bar indicates 200 µm. Scale bar for concentration map (right column in each panel) indicates intensity of fluorescence signal.

