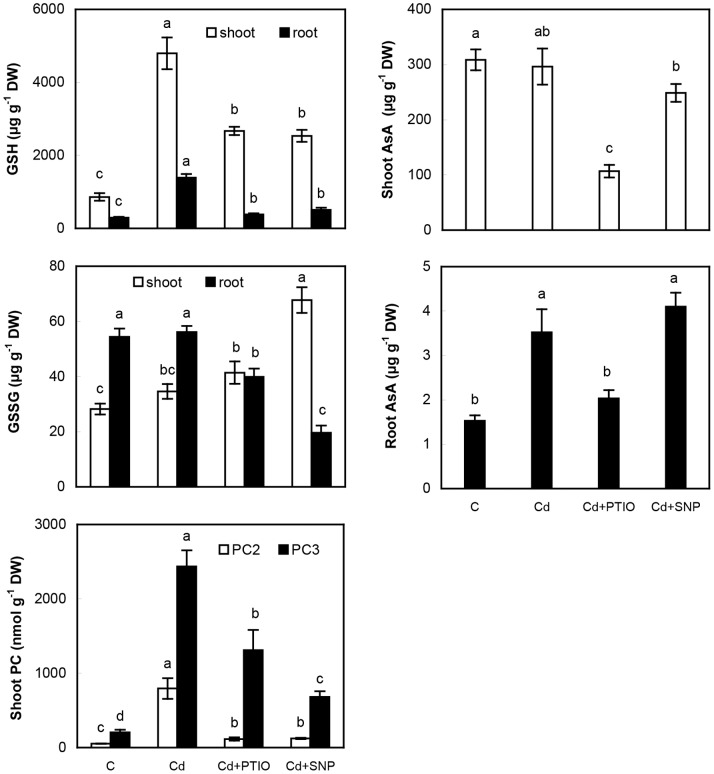
Figure 4. Quantitative changes of reduced and oxidized glutathione (GSH and GSSG, respectively), ascorbic acid (AsA) and phytochelatins (PC2, PC3) in chamomile plants after 48 h of exposure to various treatments as described in Fig. 1.
Data are means ± SDs (n = 4). Values for shoot or root followed by the same letter(s) are not significantly different according to Tukey’s test (P<0.05). Shoot means whole above-ground biomass.

