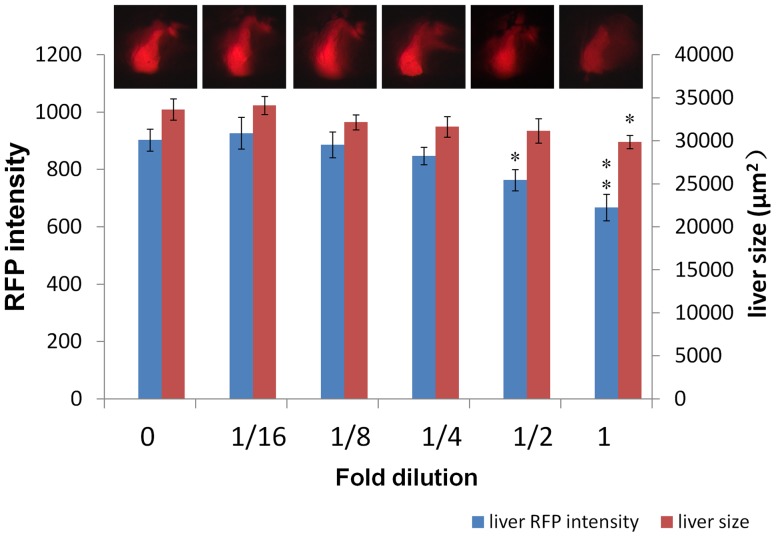
Figure 6. Combined hepatotoxin effect.
LiPan fry were treated with a mixture of four hepatotoxins with increasing dilution factors. “1″ indicates undiluted mixture with the following final concentrations in the treatment: 2.5 mg/L acetaminophen, 1 mg/L aspirin, 1 mg/L isoniazid and 0.1 mg/L phenylbutazone. “0″ represents vehicle control groups with 0.01% DMSO. All other groups are dilutions from ½ to 1/16. Blue bars indicate liver RFP intensity and red bars refer liver size. Representative liver-specific RFP expression is shown at top of each group. Asterisks indicate statistical significance: *, P<0.05; **. P<0.01.

