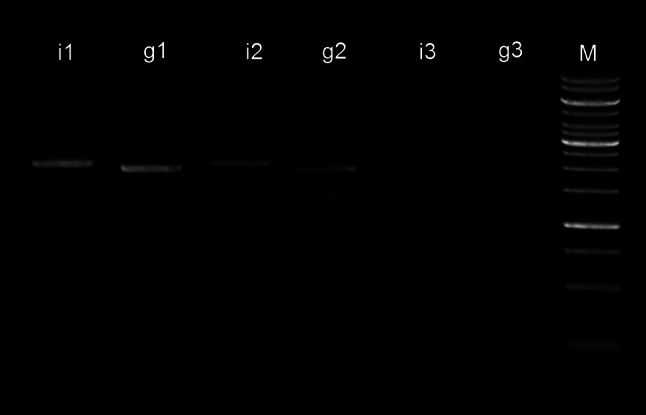
Fig. 2.

Gel electrophoresis of SQ-PCR reactions. Bands i1, i2, i3 represent 6, 2, and 0.2 % of total reaction volume loaded for insert. Bands g1, g2, and g3 represent 6, 2 and 0.2 %, respectively, of total reaction volume loaded for genomic fragment. M 1-kb DNA ladder
