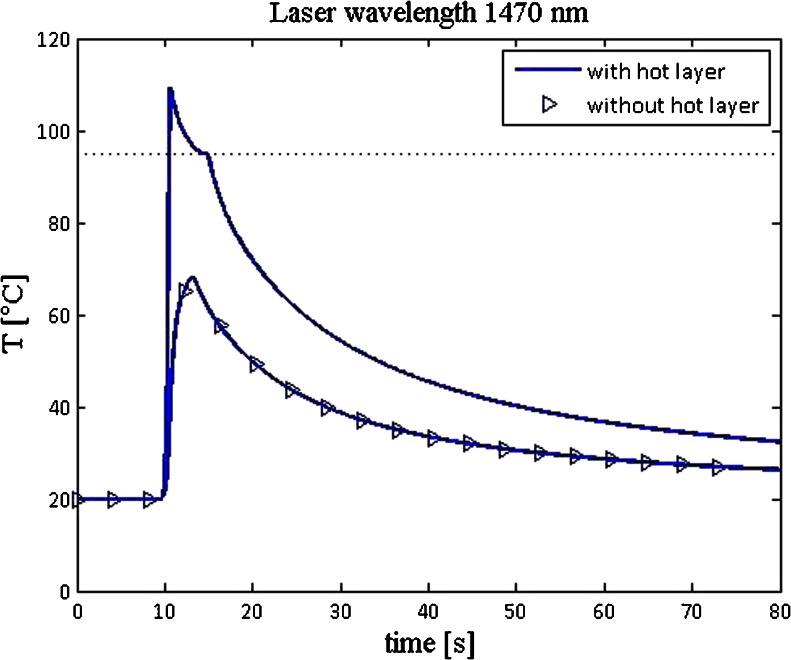
Fig. 3.
Computations of vein wall temperatures in a 3 mm diameter vein, using a 0.6 mm diameter laser fiber, 15 Watt of power, and 0.2 cm/s pullback velocity, as a function of time. The computations give the temperature at a fixed inner vein wall position, 2 cm above the fiber tip's starting position at t = 0, so the tip is closest to that vein wall position at 10 s after laser switch-on and start of pullback. The computations are either with the hot tip layer included (normal line) or simulated with this layer kept at room temperature (line with symbols) (from [23])

