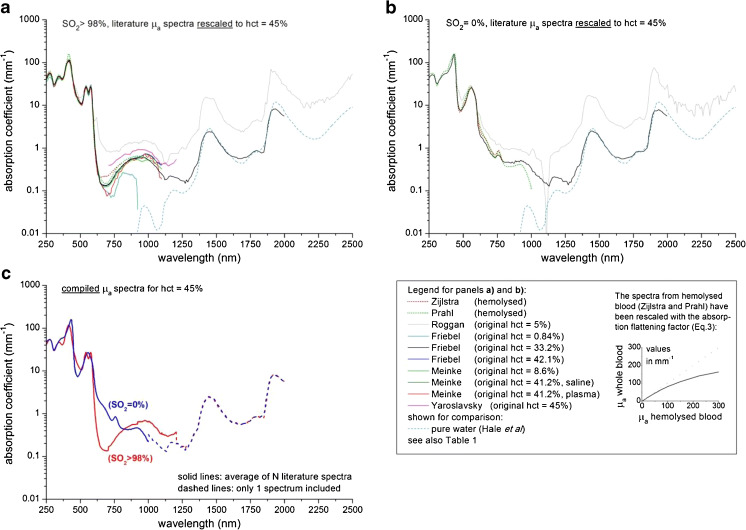
Fig. 1.
Blood absorption coefficient spectra from literature (see Table 1) within our inclusion criteria, rescaled to hct = 45 %: aμa for oxygen saturation (SO2) > 98 %, bμa for SO2 = 0 %, c compiled μa spectra for whole blood with a haematocrit of 45 %. The jumps around 1,000 and 1,200 nm in the compiled spectra are artifacts of our compilation method (caused by the transition of the average of multiple spectra to only one spectrum), which can be ignored or smoothed when using these spectra in practice. The spectra from haemolysed blood (Zijlstra and Prahl) in a and b) have been corrected for absorption flattening, see legend

