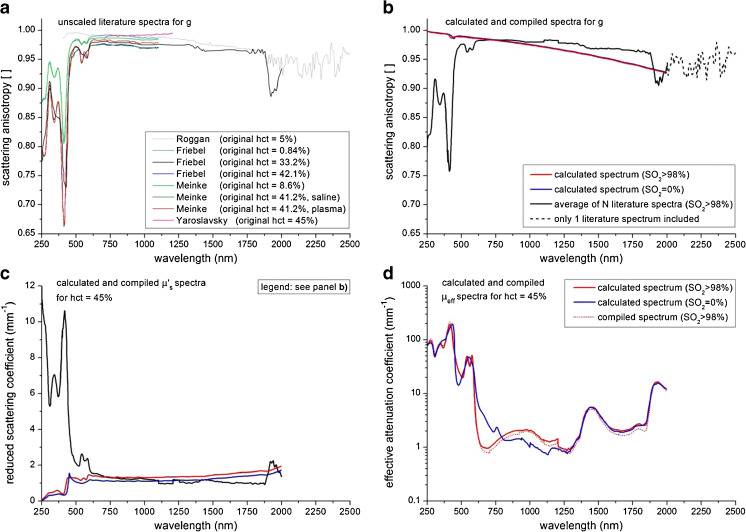
Fig. 4.
a Scattering anisotropy spectra of blood from literature (see Table 1) within our inclusion criteria, displayed for their original hcts. b Compiled spectrum for g; for comparison, also the g spectra from Fig. 2c are displayed. c Compiled μs′ spectrum for whole blood with a haematocrit of 45 %; for comparison, also the μs′ spectra from Fig. 2d are displayed. d Compiled and calculated μeff spectra spectrum for whole blood with a haematocrit of 45 %, for oxygenized (SO2 > 98 %) and deoxygenized blood (SO2 = 0 %)

