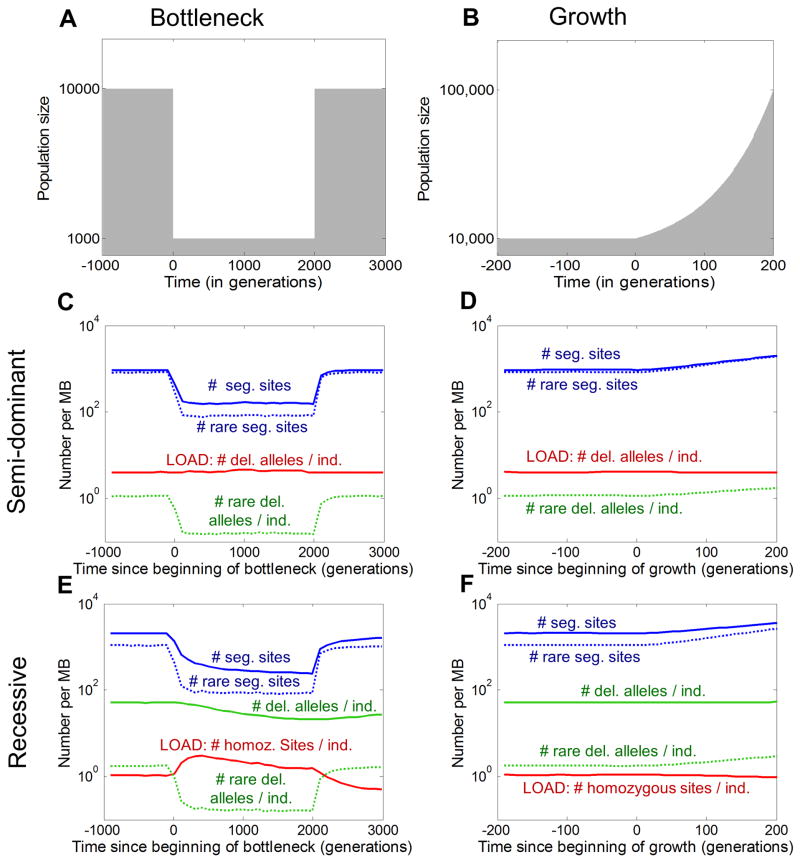
Figure 1. Time course of load and other key aspects of variation through a bottleneck (A) and exponential growth (B).
Each data line shows the expected number of variants, or alleles per MB, assuming semi-dominant mutations (C and D) or recessive mutations (E and F) with s = 1% and mutation rate per site per generation=10−8. Versions of these plots with linear scales can be found in Supplementary Figures 13, 14, and 16.

