
Figure 2. Changes in load due to changes in population size during the histories of European and African Americans for (A) semi-dominant and (B) recessive sites.
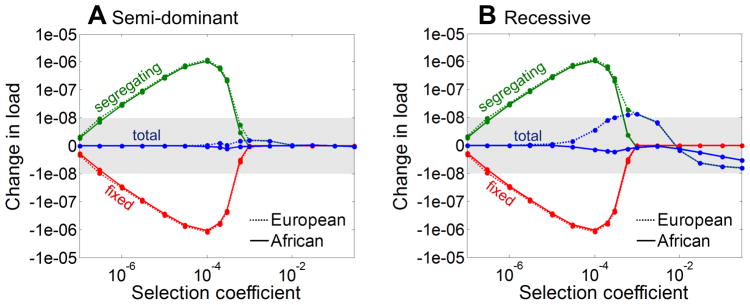
The blue lines denote the difference in load per base pair of DNA sequence in the present day population compared to the ancestral (constant) population size, as a function of selection coefficient. The green and red lines show the difference in load due to segregating and fixed variants, respectively. As can be seen, the increase in load due to segregating variation in modern populations approximately cancels out with the decrease in load due to fixed sites. The scale on the y-axis is linear within the grey region and logarithmic outside.