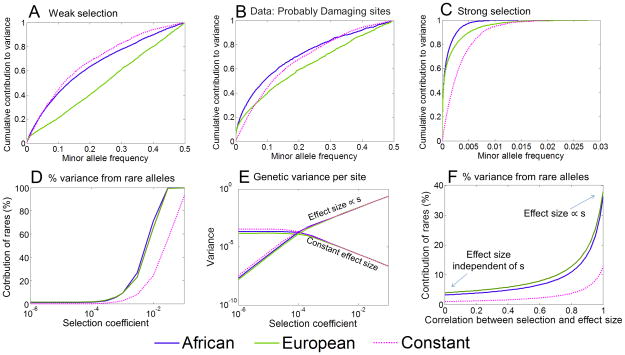
Figure 4. Predicted effect of demography on the genetic architecture of disease risk.
All the plots assume an additive trait and, with the exception of (B), are based on simulations with semi-dominant selection under the Tennessen et al.5 demographic model. Results for the constant population size model are also provided for comparison. The upper plots show the cumulative fractions of genetic variance due to alleles at frequency < x, based on: (A) simulated data with weak selection (s =.0002); (B) assuming the observed frequency spectrum at “probably damaging” sites6, 22, where a constant population size of 14,474 and selection coefficient of 0.02% are used for comparison; and (C) simulated data with strong selection (s = .01). Panel (D) depicts the fraction of variance due to rare alleles (i.e., < 0.1%) as a function of the selection coefficient; (E) shows the per-site contribution to variance as a function of the selection coefficient under two extreme models, with effect sizes that are either independent of s (constant) or proportional to s; (F) shows the expected fraction of the variance due to rare variants (i.e., < 0.1%) as a function of the correlation between the selection on, and effect size of variants. Further details on the model are provided in the Methods.

