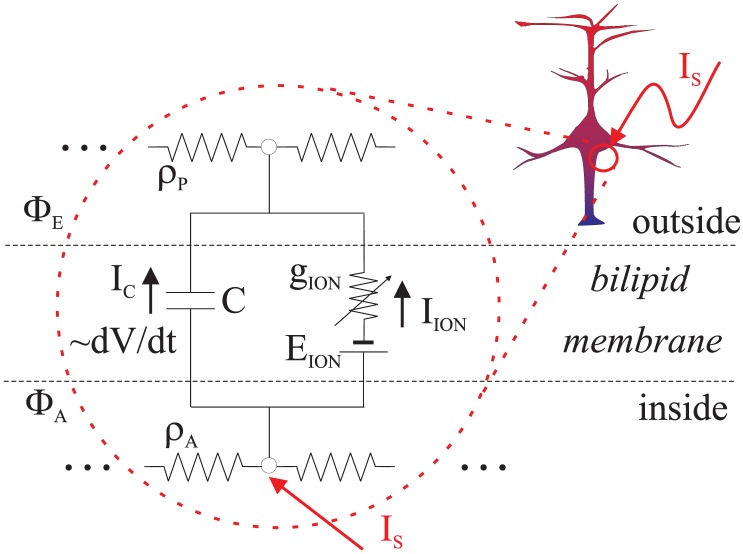
Figure 1. Excitability model template: The equivalent circuit represents the simplified electro-dynamics of an excitable membrane.
 is the intra-cellular stimulation current.
  is the capacitive current. The direction of the latter is for a case of depolarizing the membrane’s voltage (i.e. the inside of the cell wall becoming more positive). The algebraic sum of all the ionic and all axial currents is represented by
  where
where  stands for the algebraic difference (divergence) of in- and out-going axial currents.

