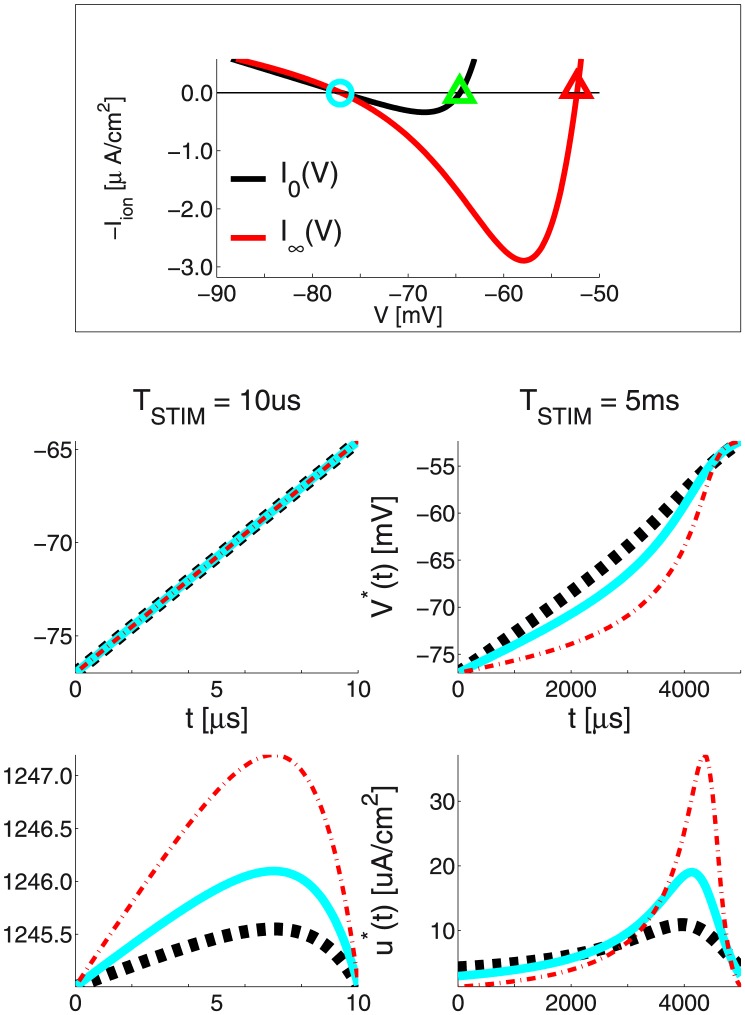
Figure 6. LAP optimal waveforms  and
and  for the 0D HHM: The
  approximation of the ionic current is used for a case of very short duration (
 = 10
= 10  ) and the
  approximation is used for a case of long duration (
 = 5
= 5  ) (see the Box).
As with the IM, bvp4c was used to numerically solve the BVP of eqn. (34). The figure follows a quite similar format to Fig. 5.  can also be assumed higher or lower. All the maximal ionic conductances in the HHM (see also Table 3) are temperature-dependent and are linearly proportional to the coefficient
  . The 3 solutions shown correspond to the ionic current at
  (cyan trace), twice higher (thin red dash-dot), or twice lower (thick dashed black)
  respectively. From eqn. (42) we can see that
  = 1.6047 (half the nominal) at
  , and
, and  = 6.4188 (twice the nominal) for at
  . Box: Resting-state
  and asymptotic-state
  ionic currents for the 0D HHM; Markers are inserted at the resting and threshold membrane-voltage points, respectively
  = −77
= −77  ,
,  = −64.55
  and
and  = −52.35
  .
.

