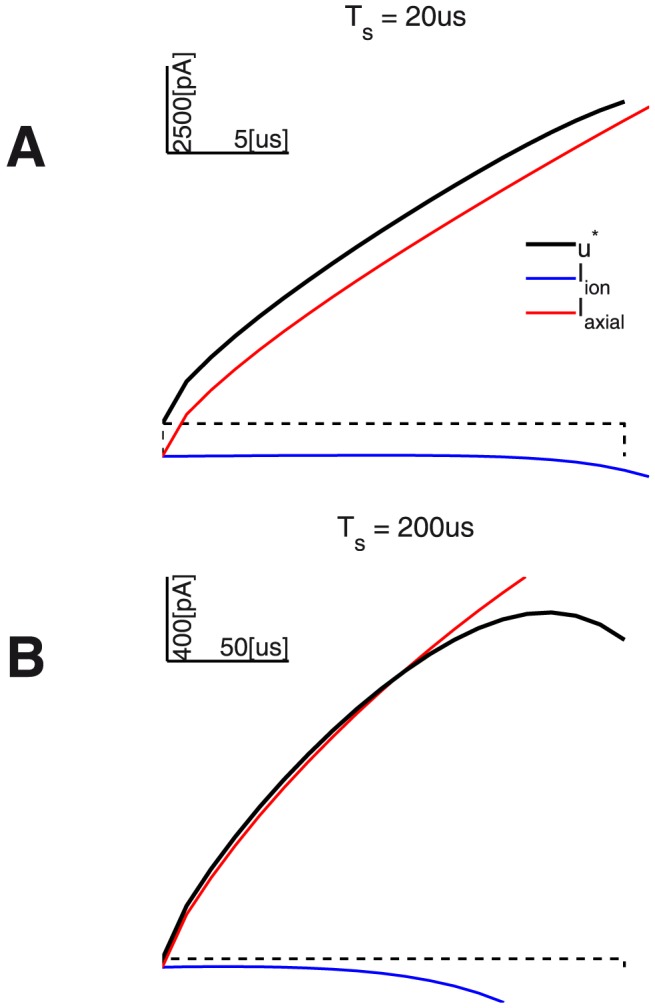
Figure 11. Optimal waveforms  ,
,  = 20, 200
  : The figure also provides the corresponding optimal
  -like linear-growth-related current
  (dashed black), as well as the components of
  - respectively the
  (blue traces) and
  (red traces) current trajectories.

