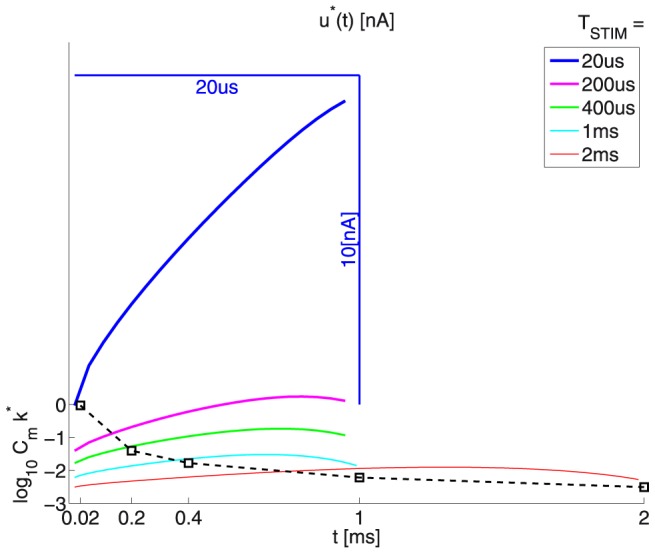
Figure 12. Optimal waveforms  : see also Fig. 11. Notes:

Since here  , where
  is given by eqn. (41), from eqn. (6)
  . The figure is optimized to present clearly both
  and
and  (*1) The dashed trace at the bottom plots
  as a function of
  (*2) Toward equally good plot visibility, for all durations
  , the waveforms
  are rubber-banded to take the same graph width as the 1 ms-waveform. This is illustrated by the scale bars for the shortest duration
  = 20
= 20  . (*3) The vertical scale is the same for all plots, except for the logarithmic offset, as defined by pt. (*1) above.
